Article Outline
大阪府陽性者の属性と市町村別陽性者マップ(新型コロナウイルス:Coronavirus)
(参考)大阪府の最新感染動向
大阪府 新型コロナウイルス感染症対策サイトにあるデータを使います。
月別死亡者数 : 東洋経済オンライン
大阪府 vs 東京都 : 新型コロナウイルス 人口100万人あたりの死亡者数(データ:NHK 新型コロナ データ)
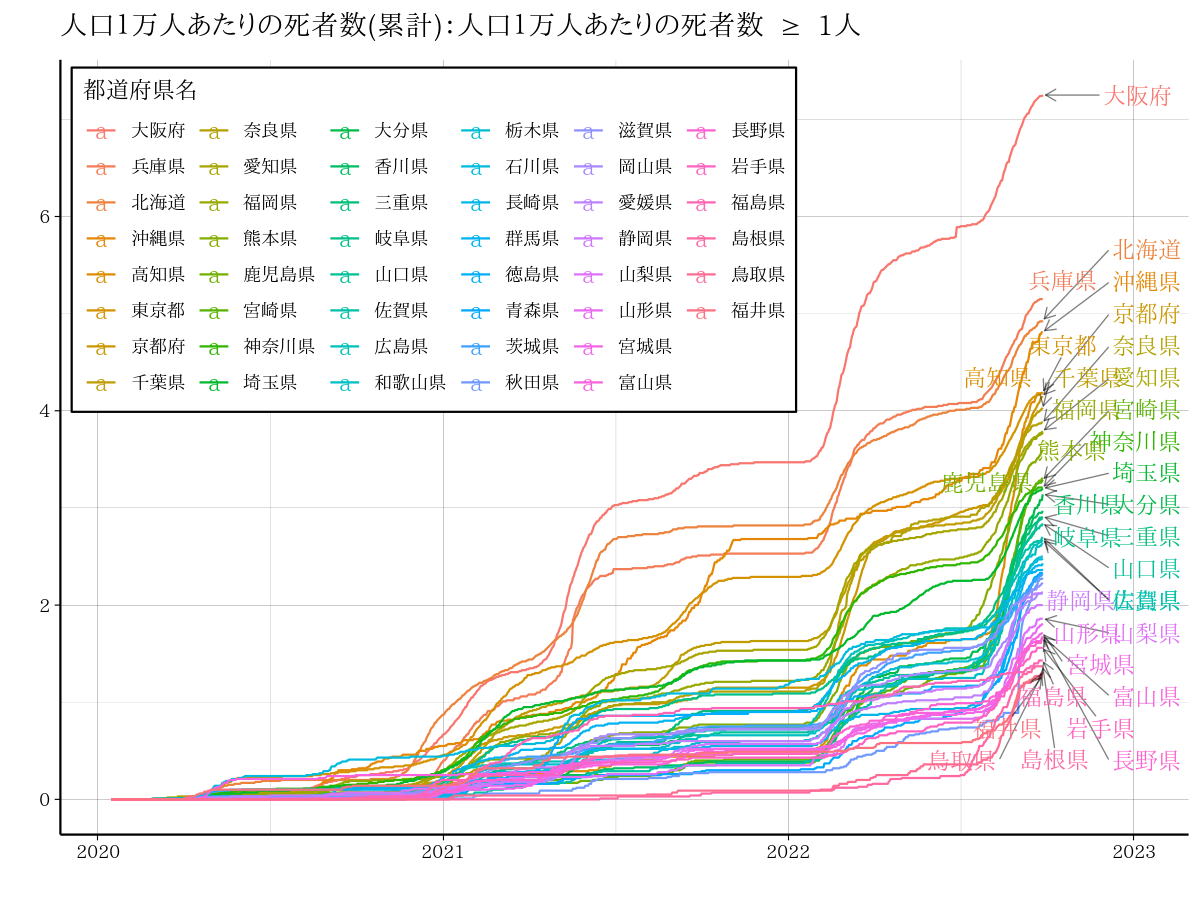
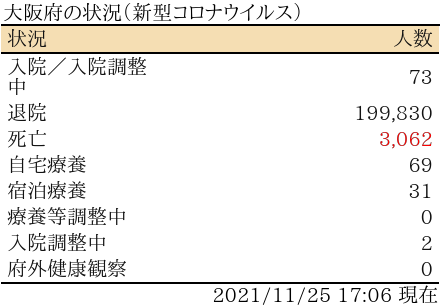
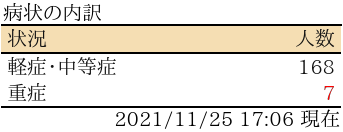
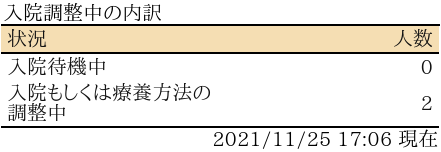
表:大阪府の状況(新型コロナウイルス)

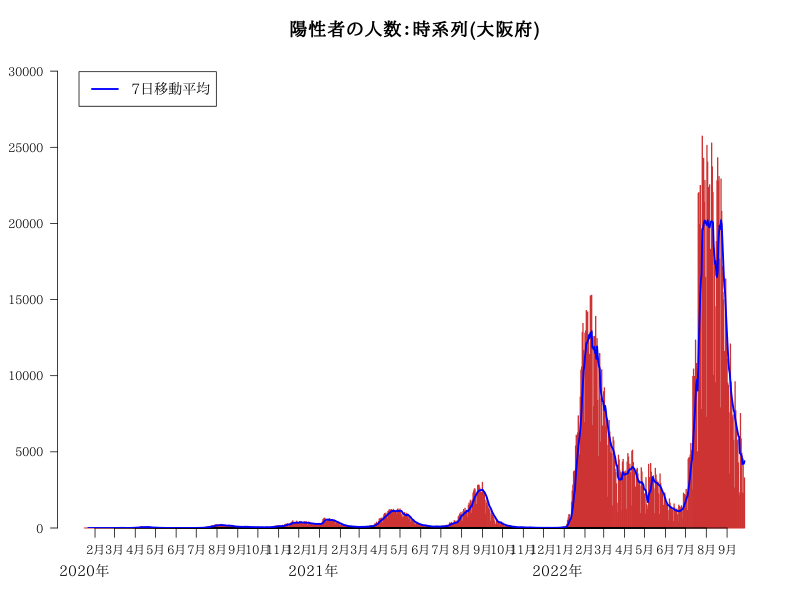
陽性者の人数:時系列(大阪府)
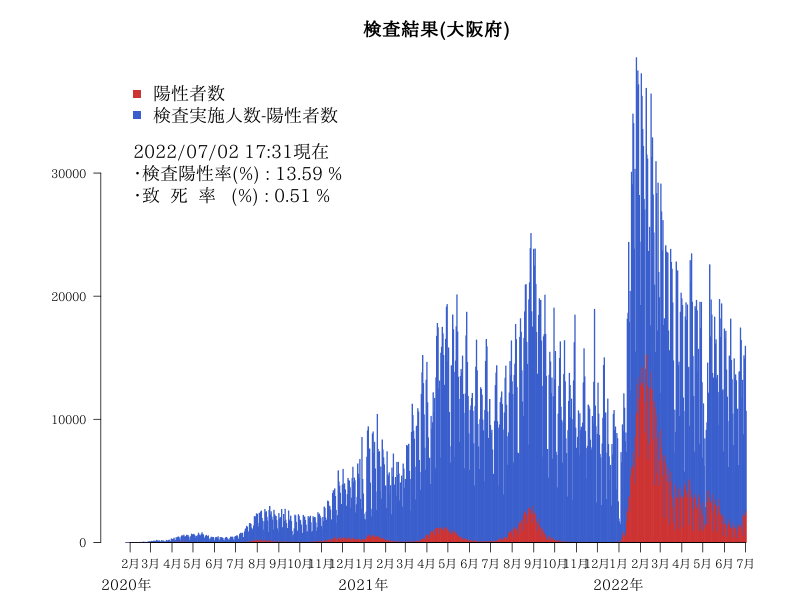
検査結果(大阪府)
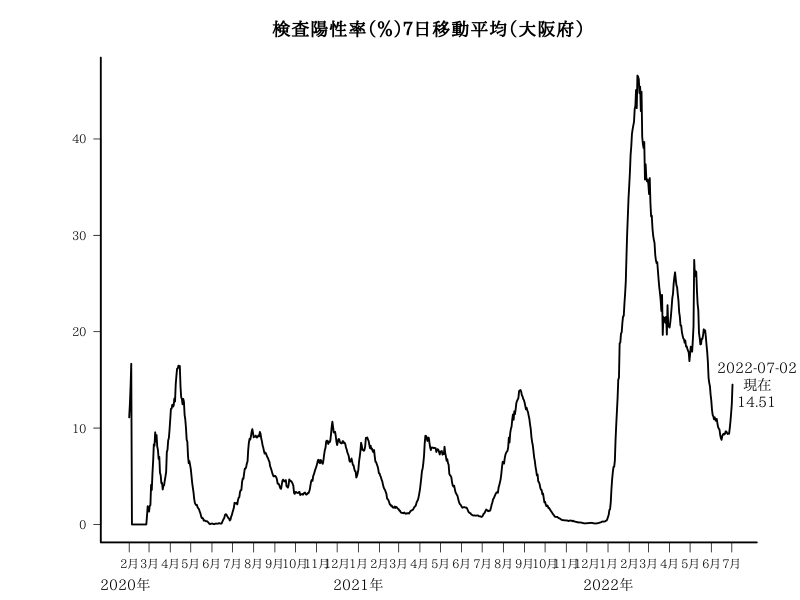
検査陽性率(%)7日移動平均(大阪府)
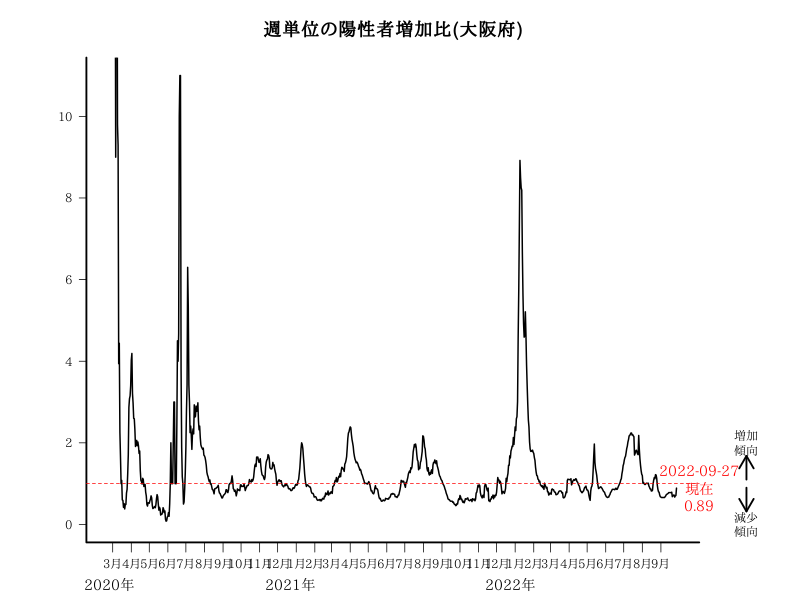
週単位の陽性者増加比(大阪府)
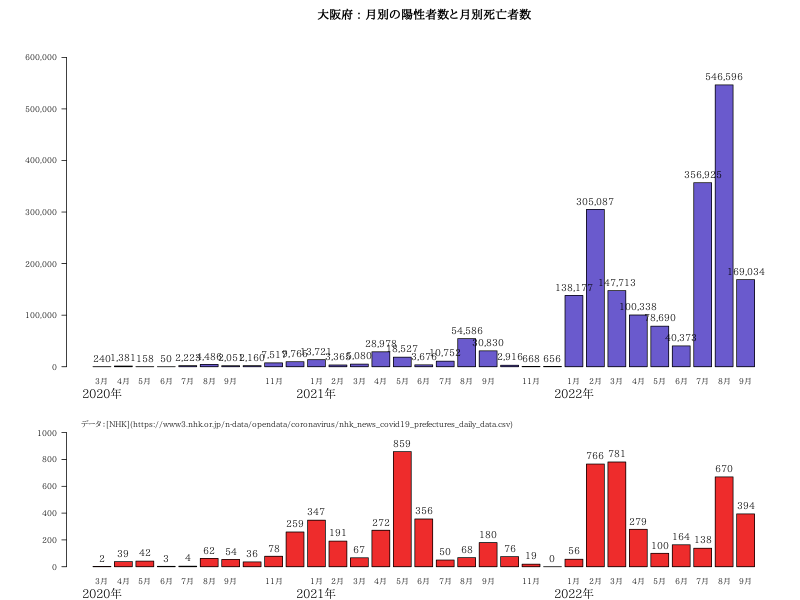
大阪府 : 月別の陽性者数と月別死亡者数
月別死亡者数のデータは「NHK」のデータから作成しています。
「大阪市発表の死者の総数 - NHKの死者の総数」(プラスの場合)を最終月のデータの数に加えるようにしました。
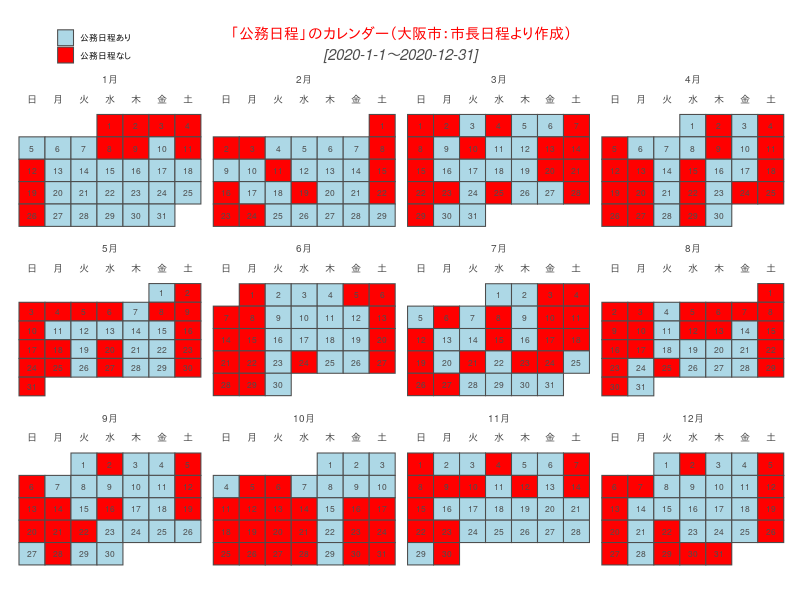
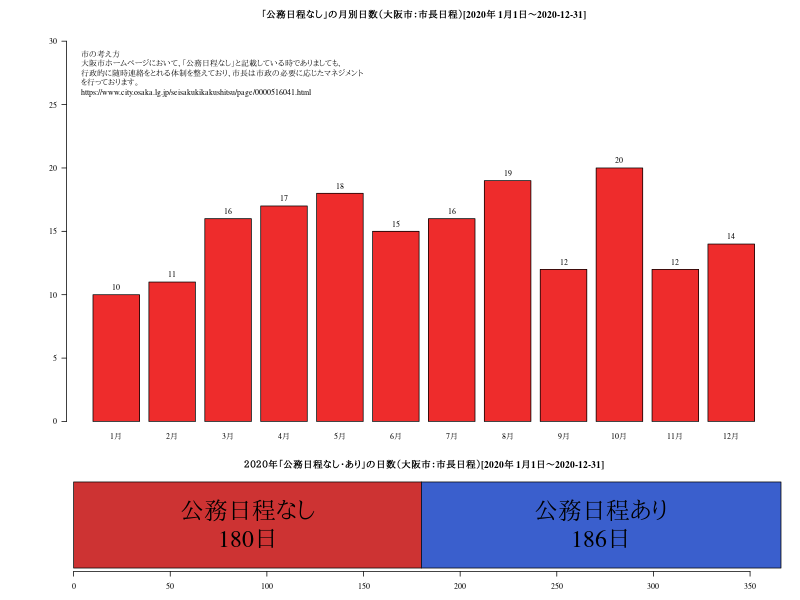
大阪市:市長の公務ありなしのカレンダーと公務日程なしの月別日数
Rコード
(json形式)データ読み込み
#install.packages("jsonlite")
#install.packages("curl")
library(jsonlite)
library(knitr)
library(TTR)
url<- "https://raw.githubusercontent.com/codeforosaka/covid19/master/data/data.json"
js<- fromJSON(url)
names(js)
#[1] "patients"                   "patients_summary"
#[3] "inspections_summary"
#    "contacts1_summary"  府民向け相談窓口への相談件数
#[5] "contacts2_summary" 新型コロナ受診相談センターへの相談件数
#    "transmission_route_summary" 感染経路不明者(リンク不明者)
#[7] "treated_summary" 陰性確認済(退院者累計)           "lastUpdate"
#[9] "main_summary"
陽性者の人数:時系列(大阪府)
#date
tbl<- data.frame(小計=js[[2]]$data$小計)
rownames(tbl)<- substring(js[[2]]$data$日付,1,10)
#元から日付順になっているのでこの部分は不要
#tbl<- tbl[order(names(tbl))]
sma7<- round(SMA(tbl,7),2)
#png("covOsaka01.png",width=800,height=600)
par(mar=c(5,4,4,2),family="serif")
b<- barplot(t(tbl),las=1,ylim=c(0,max(tbl)*1.2),col="red",axisnames=F)
labelpos<- paste0(1:12,"/",1)
for (i in labelpos){
    at<- match(i,sub("-","/",sub("-0","-",sub("^0","",substring(rownames(tbl),6,10)))))
    if (!is.na(at)){ axis(1,at=b[at],labels = paste0(sub("/1","",i),"月"),tck= -0.02)}
    }
mtext(text="2020年",at=b[1],side=1,line=2.5,cex=1.2)
mtext(text="2021年",at=b[342],side=1,line=2.5,cex=1.2)
lines(x=b,y=sma7$SMA,lwd=2.5,col="blue")
legend("topleft",inset=0.03,lwd=2.5,col="blue",legend="7日移動平均",cex=1.2)
title("陽性者の人数:時系列(大阪府)",cex.main=1.5)
#
labels<- rownames(tbl)
events<- data.frame(
    date=c("2020-04-14","2020-04-15","2020-08-04","2020-11-01","2020-12-14"),
    events=c("4月14日\n大阪ワクチン\n会見\n「早ければ7月にも治験を始めたい」","4月中旬\n「雨合羽」寄付受付",
    "8月4日\nイソジン会見\n「ウソみたいなホントの話をさせて頂きたい」",    "11月1日\n大阪市廃止・\n特別区設置\n住民投票",
    "12月14日\n感染者14人死亡\n過去最多"),
    ypos= c(350,500,450,450,500))
#
for (i in 1:nrow(events)){
    labelpos<- events$date[i]
    xpos<- b[match(labelpos,labels)]
    ypos<- events$ypos[i]
    points(x=xpos,y=ypos,pch=25,bg="red",cex=1.2,xpd=T)
    text(x=xpos,y=ypos,labels=events$events[i],xpd=T,pos=3)
}
#grep("2021-01-08",substring(js[[2]]$data$日付,1,10))
points(x=b[349],y=670,pch=25,bg="red",cex=1.2,xpd=T)
text(x=b[349],y=670,labels="2021/1/8\n感染者19人死亡\n最多更新",xpd=T,pos=3)
#dev.off()
検査結果(大阪府)
# 検査陽性率(%): 陽性患者数/検査実施人数*100
Pos<- round(js[[10]][[3]]$value/js[[10]][[2]]*100,2)
# 致死率(%): 亡くなった人の数/陽性患者数*100
Dth<- round(js[[10]][[3]][[3]][[1]][grep("死亡",js[[10]][[3]][[3]][[1]]$attr),2]/js[[10]][[3]]$value*100,2)
#
dat<- js[[2]][[2]]
dat<- merge(dat,js[[3]][[2]],by=1)
rownames(dat)<- substring(dat[,1],1,10)
dat<- dat[,-1]
dat[,3]<- dat[,2]-dat[,1]
colnames(dat)<- c("陽性者数","検査実施人数","陰性者数")
ritsu1<- paste("・検査陽性率(%) :",Pos,"%")
ritsu2<- paste("・致  死  率   (%) :",Dth,"%")
# png("covOsaka05.png",width=800,height=600)
par(mar=c(4,7,4,2),family="serif")
barplot(t(dat[,c(1,3)]),xaxt="n",las=1,col=c("red","lightblue"),ylim=c(0,max(dat,na.rm=T)))
labelpos<- paste0(1:12,"/",1)
for (i in labelpos){
    at<- match(i,sub("-","/",sub("-0","-",sub("^0","",substring(rownames(dat),6,10)))))
    if (!is.na(at)){ axis(1,at=b[at],labels = paste0(sub("/1","",i),"月"),tck= -0.02)}
    }
mtext(text="2020年",at=b[1],side=1,line=2.5,cex=1.2)
mtext(text="2021年",at=b[341],side=1,line=2.5,cex=1.2)
legend("topleft",inset=0.03,bty="n",pch=15,col=c("red","lightblue"),cex=1.5,
    legend=c("陽性者数","検査実施人数-陽性者数"))
legend("topleft",inset=c(0,0.15),bty="n",cex=1.5,legend=c(paste0(js[[9]],"現在"),ritsu1,ritsu2))
title("検査結果(大阪府)",cex.main=1.5)
#dev.off()
検査陽性率(%)7日移動平均(大阪府)
library(TTR)
dat<- js[[2]][[2]]
dat<- merge(dat,js[[3]][[2]],by=1)
rownames(dat)<- substring(dat[,1],1,10)
dat<- dat[,-1]
colnames(dat)<- c("陽性者数","検査実施件数")
# 検査陽性率(%)7日移動平均
#陽性者数(7日間合計)/検査実施件数(7日間合計)*100
sma<- round(runSum(dat$陽性者数,7)/runSum(dat$検査実施件数,7)*100,2)
#png("covOsaka07.png",width=800,height=600)
par(mar=c(4,7,4,3),family="serif")
plot(sma,type="l",lwd=2.5,las=1,xlab="",ylab="",xaxt="n",bty="n")
box(bty="l",lwd=2.5)
labelpos<- paste0(1:12,"/",1)
for (i in labelpos){
    at<- match(i,sub("-","/",sub("-0","-",sub("^0","",substring(rownames(dat),6,10)))))
    if (!is.na(at)){ axis(1,at=at,labels = paste0(sub("/1","",i),"月"),tck= -0.02)}
    }
mtext(text="2020年",at=1,side=1,line=2.5,cex=1.2)
mtext(text="2021年",at=341,side=1,line=2.5,cex=1.2)
text(x=par("usr")[2],y=sma[length(sma)],labels=paste0(rownames(dat)[nrow(dat)],"\n現在\n",sma[length(sma)]),xpd=T,cex=1.2)
title("検査陽性率(%)7日移動平均(大阪府)",cex.main=1.5)
#dev.off()
週単位の陽性者増加比(大阪府)
#週単位の陽性者増加比
library(TTR)
dat<- js[[2]][[2]]
rownames(dat)<- substring(dat[,1],1,10)
dat<- dat[,-1,drop=F]
#
e7<- runSum(dat,n=7)
b7<- runSum(dat,n=14) - e7
df<- round(e7/b7,2)
# InfにNAを入れる
df[df==Inf]<- NA
df<- data.frame(date=rownames(dat),zougen= df)
df<- df[40:nrow(df),]
#
#png("covOsaka08.png",width=800,height=600)
par(mar=c(4,6,4,7),family="serif")
plot(df[,2],type="l",lwd=2,las=1,ylim=c(0,11),xlab="",ylab="",xaxt="n",bty="n")
box(bty="l",lwd=2.5)
#
labelpos<- paste0(1:12,"/",1)
for (i in labelpos){
    at<- match(i,sub("-","/",sub("-0","-",sub("^0","",substring(df[,1],6,10)))))
    if (!is.na(at)){ axis(1,at=at,labels = paste0(sub("/1","",i),"月"),tck= -0.02)}
    }
mtext(text="2020年",at=1,side=1,line=2.5,cex=1.2)
mtext(text="2021年",at=303,side=1,line=2.5,cex=1.2)
abline(h=1,col="red",lty=2)
text(x=par("usr")[2],y=df[,2][nrow(df)],labels= paste0(df[,1][nrow(df)],"\n現在\n",df[,2][nrow(df)]),xpd=T,cex=1.2,col="red")
arrows(par("usr")[2]*1.08, 1.1,par("usr")[2]*1.08,1.68,length = 0.2,lwd=2.5,xpd=T)
text(x=par("usr")[2]*1.08,y=2,labels="増加\n傾向",xpd=T)
arrows(par("usr")[2]*1.08, 0.9,par("usr")[2]*1.08,0.32,length = 0.2,lwd=2.5,xpd=T)
text(x=par("usr")[2]*1.08,y=0,labels="減少\n傾向",xpd=T)
title("週単位の陽性者増加比(大阪府)",cex.main=1.5)
#dev.off()
大阪府 : 月別の陽性者数と月別死亡者数
m<- data.frame(month=substring(js[[2]]$data$日付,1,7),小計=js[[2]]$data$小計)
#各月ごとの検査陽性者数
cdata<- tapply(m$小計,m$month, sum,na.rm=T)
#
#png("covOsaka09_01.png",width=800,height=600)
par(mar=c(4,5,3,2),family="serif")
b<- barplot(cdata,las=1,col="red",names=paste0(c(1:12,1),"月"),ylim=c(0,max(cdata)*1.2),yaxt="n")
# Add comma separator to axis labels
axis(side=2, at=axTicks(2), labels=formatC(axTicks(2), format="d", big.mark=','),las=1)
text(x= b[1:nrow(cdata)], y=as.numeric(cdata),labels=formatC(as.numeric(cdata), format="d", big.mark=','),cex=1.2,pos=3)
mtext(text="2020年",at=b[1],side=1,line=2.5,cex=1.2)
mtext(text="2021年",at=b[13],side=1,line=2.5,cex=1.2)
legend("topleft",inset=c(0,0),xpd=T,bty="n",
    legend="データ:https://raw.githubusercontent.com/codeforosaka/covid19/master/data/data.json")
title("大阪府 : 月別の陽性者数",cex.main=1.5)
#dev.off()
library(xts)
#[NHK](https://www3.nhk.or.jp/n-data/opendata/coronavirus/nhk_news_covid19_prefectures_daily_data.csv)
nhkC<- read.csv("https://www3.nhk.or.jp/n-data/opendata/coronavirus/nhk_news_covid19_prefectures_daily_data.csv")
save(nhkC,file="nhkC.Rdata")
#load("nhkC.Rdata")
# 大阪府(code:27)
code<- 27
data<- nhkC[nhkC$都道府県コード==code,c(1,6)]
data.xts<- as.xts(read.zoo(data, format="%Y/%m/%d"))
#各月ごとの死亡者の合計
monthsum.xts<- apply.monthly(data.xts[,1],sum)
#2020年3月から(1、2月分(0)は削除)
monthsum.xts<- monthsum.xts[-c(1:2)]
monthsum<- data.frame(coredata(monthsum.xts))
rownames(monthsum)<- substring(index(monthsum.xts),1,7)
if (rownames(monthsum)[nrow(monthsum)]!="2021-01"){
    monthsum= rbind(monthsum,0)
}
#
#png("covOsaka09_02.png",width=800,height=600)
par(mar=c(3,7,3,2),family="serif")
mat <- matrix(c(1,1,1,1,2,2),3,2, byrow = TRUE)
layout(mat)
#3月以降
b<- barplot(cdata[-c(1:2)],las=1,col="slateblue",names=paste0(c(3:12,1),"月"),ylim=c(0,max(cdata)*1.2),yaxt="n")
axis(side=2, at=axTicks(2), labels=formatC(axTicks(2), format="d", big.mark=','),las=1)
text(x= b, y=cdata[-c(1:2)],labels=formatC(cdata[-c(1:2)], format="d", big.mark=','),cex=1.2,pos=3)
title("大阪府 : 月別の陽性者数と月別死亡者数",cex.main=1.5)
# 大阪府発表の死者の総数-NHKの死者の総数を最終月のデータの数に加える
sa<- js[[10]][[3]][[3]][[1]][grep("死亡",js[[10]][[3]][[3]][[1]]$attr),2]-sum(data.xts)
# saがマイナスのときは0にする
if (sa<0){sa=0}
monthsum[nrow(monthsum),]<- monthsum[nrow(monthsum),] + sa
b<- barplot(t(monthsum),las=1,col="firebrick2",names=paste0(c(3:12,1),"月"),ylim=c(0,max(monthsum)*1.2))
text(x= b[1:nrow(monthsum)], y=as.vector(monthsum)[,1],labels=as.vector(monthsum)[,1],cex=1.2,pos=3)
legend("topleft",inset=c(0,-0.1),xpd=T,bty="n",
    legend="データ:[NHK](https://www3.nhk.or.jp/n-data/opendata/coronavirus/nhk_news_covid19_prefectures_daily_data.csv)")
#dev.off()
大阪市:市長の公務ありなしのカレンダーと公務日程なしの月別日数
大坂市の「これまでの市長日程」のテーブル部分を抽出
library(calendR)
library(rvest)
#これまでの市長日程
p<- c("0000342310","0000346760","0000351186","0000353763","0000361763","0000361768",
    "0000361957","0000361965","0000361978","0000361979","0000361980","0000361981")
#
koumu<- NULL
for ( i in p){
page<- paste0("https://www.city.osaka.lg.jp/seisakukikakushitsu/page/",i,".html")
# 読み込み
html <- read_html (page, encoding = "UTF-8")
x<- html_table(html)[[1]]
x1<- x[x$内容=="公務日程なし",c(1,3)]
koumu<- rbind(koumu,x1[order(as.numeric(rownames(x1)),decreasing=T),])
}
#
koumu<- koumu[,1 ]
#
#公務日程なしの日付 曜日削除
days<- gsub("(.*)","",koumu)
days<- as.Date(paste0("2020-",gsub("日","",gsub("月","-",days))))
公務日程なしの月別日数
#png("KoumuOsakashi.png",width=800,height=600)
mat <- matrix(c(1,1,1,1,1,1,2,2),4,2, byrow = TRUE)
layout(mat)
par(mar=c(3,7,3,2),family="serif")
b<- barplot(table(substring(days,6,7)),las=1,ylim=c(0,31),col="firebrick2",names=paste0(1:12,"月"))
text(x=b,y=table(substring(days,6,7)),labels=table(substring(days,6,7)),pos=3)
legend(x="topleft",legend="市の考え方
大阪市ホームページにおいて、「公務日程なし」と記載している時でありましても、
行政的に随時連絡をとれる体制を整えており、市長は市政の必要に応じたマネジメント
を行っております。
https://www.city.osaka.lg.jp/seisakukikakushitsu/page/0000516041.html",bty="n")
title("「公務日程なし」の月別日数(大阪市:市長日程)[2020年]")
#
yeardata<- sum(table(substring(days,6,7)))
b<- barplot(matrix(c(yeardata,366-yeardata),nrow=2),horiz=T,col=c("brown3","royalblue3"))
# x:yeardata/2=90 yeardata+(366-yeardata)/2
text(x=c(90,273),y=b,labels=c(paste0("公務日程なし\n",yeardata,"日"),paste0("公務日程あり\n",(366-yeardata),"日")),cex=3)
title("2020年「公務日程なし・あり」の日数(大阪市:市長日程)")
#dev.off()
市長の公務ありなしのカレンダー
# 2020-01-01を1日目として何日目に当たるかを計算
no_koumu<- as.numeric(as.Date(days)-as.Date("2020-01-01")+1)
#
# Vector of dates
dates <- seq(as.Date("2020-01-01"), as.Date("2020-12-31"), by = "1 day")
# Vector of "公務日程あり"
events <- rep("公務日程あり",length(dates))
# Adding more events
events[no_koumu] <- "公務日程なし"
# +2 : データのある日の次の日
#events[as.numeric(as.Date(last)-as.Date("2020-01-01")+2):length(dates)] <- NA
# Creating the calendar
#png("Okoumu02.png",width=800,height=600)
calendR(year = 2020,
        start = "S",
        special.days = events,
        special.col = c("lightblue","red"), # as events
    title = "「公務日程」のカレンダー(大阪市:市長日程より作成)",  # Change the title
        title.size = 15,                  # Font size of the title
        title.col = 2,                    # Color of the title
        subtitle = "[2020]" ,
    subtitle.size = 15,
    weeknames = c("月","火","水","木","金","土","日"),
    legend.pos = c(0.1,1.15))
#dev.off()
表:大阪府の状況(新型コロナウイルス)
pngファイルで保存
# webshot::install_phantomjs()
library(flextable)
library(tibble)
library(webshot)
# 状況の部分を抽出
Cs<- js[[10]][[3]][[3]][[1]]
# 大阪府の状況(新型コロナウイルス)
ft <- flextable(data.frame(状況=Cs$attr,人数=formatC(Cs$value, format="d", big.mark=',')))
ft <- bg(ft, bg = "wheat", part = "header")
ft <- color(ft, i= 3,j=2, color = "red", part = "body")
ft<- align(ft, i = NULL, j = 2, align = "right",part="all")
#ft <- set_header_labels(ft, rowname = "状況")
ft<- add_header_lines(ft, values = "大阪府の状況(新型コロナウイルス)")
ft<- add_footer_lines(ft, values =paste(js[[9]],"現在"))
ft<- align(ft, i = NULL, j = NULL, align = "right",part="footer")
# 'all', 'body', 'header', 'footer')
ft <- fontsize(ft, size = 20, part = "all")
#ft <- autofit(ft)
ft<- set_table_properties(ft, width = 0.45, layout = "autofit")
#ft
save_as_image(ft, path = "covOsaka20.png", zoom = 1, expand = 1, webshot = "webshot")
#
# 病状の内訳
ft <- flextable(data.frame(状況=Cs$children[[1]]$attr,人数=formatC(Cs$children[[1]]$value, format="d", big.mark=',')))
ft <- bg(ft, bg = "wheat", part = "header")
ft <- color(ft, i= 2,j=2, color = "red", part = "body")
ft<- align(ft, i = NULL, j = 2, align = "right",part="all")
ft<- add_header_lines(ft, values = "病状の内訳")
ft<- add_footer_lines(ft, values =paste(js[[9]],"現在"))
ft<- align(ft, i = NULL, j = NULL, align = "right",part="footer")
ft <- fontsize(ft, size = 20, part = "all")
ft<- set_table_properties(ft, width = 0.35, layout = "autofit")
save_as_image(ft, path = "covOsaka20_1.png", zoom = 1, expand = 1, webshot = "webshot")
#
# 入院調整中の内訳
ft <- flextable(data.frame(状況=Cs$children[[7]]$attr,人数=formatC(Cs$children[[7]]$value, format="d", big.mark=',')))
ft <- bg(ft, bg = "wheat", part = "header")
ft<- align(ft, i = NULL, j = 2, align = "right",part="all")
ft<- add_header_lines(ft, values = "入院調整中の内訳")
ft<- add_footer_lines(ft, values =paste(js[[9]],"現在"))
ft<- align(ft, i = NULL, j = NULL, align = "right",part="footer")
ft <- fontsize(ft, size = 20, part = "all")
ft<- set_table_properties(ft, width = 0.45, layout = "autofit")
save_as_image(ft, path = "covOsaka20_2.png", zoom = 1, expand = 1, webshot = "webshot")
#
#検査実施人数 & 陽性患者数
ft <- flextable(data.frame(検査の状況=c("検査実施人数","陽性患者数"),人数=formatC(c(js[[10]][[2]],js[[10]]$children$value), format="d", big.mark=',')))
ft <- bg(ft, bg = "wheat", part = "header")
ft<- align(ft, i = NULL, j = 2, align = "right",part="all")
ft<- add_header_lines(ft, values = "検査実施人数 & 陽性患者数")
ft<- add_footer_lines(ft, values =paste(js[[9]],"現在"))
ft<- align(ft, i = NULL, j = NULL, align = "right",part="footer")
ft <- fontsize(ft, size = 20, part = "all")
ft<- set_table_properties(ft, width = 0.45, layout = "autofit")
save_as_image(ft, path = "covOsaka20_3.png", zoom = 1, expand = 1, webshot = "webshot")
大阪府 vs 東京都 : 新型コロナウイルス 人口100万人あたりの死亡者数
library(sf)
library(NipponMap)
shp <- system.file("shapes/jpn.shp", package = "NipponMap")[1]
m <- sf::read_sf(shp)
#[NHK:新型コロナ データ一覧](https://www3.nhk.or.jp/news/special/coronavirus/data-widget/)
nhkC<- read.csv("https://www3.nhk.or.jp/n-data/opendata/coronavirus/nhk_news_covid19_prefectures_daily_data.csv")
# 東京都
code<-13
data<- nhkC[nhkC$都道府県コード==code,c(1,7)]
data.xts<- as.xts(read.zoo(data, format="%Y/%m/%d"))
data.xts<- round(data.xts[,1]*1000000/m$population[code],2)
# 大阪府
code<-27
data<- nhkC[nhkC$都道府県コード==code,c(1,7)]
tmp.xts<- as.xts(read.zoo(data, format="%Y/%m/%d"))
tmp.xts<- round(tmp.xts[,1]*1000000/m$population[code],2)
data.xts<- merge(data.xts,tmp.xts)
colnames(data.xts)<- c("Tokyo","Osaka")
#
#png("covOvsT01.png",width=800,height=600)
par(mar=c(5,4,5,6),family="serif")
matplot(coredata(data.xts),type="l",lwd=2.5,lty=1,las=1,xaxt="n",yaxt="n",ylim=c(0,max(data.xts,na.rm=T)*1.1),col=c("blue","red"),xlab="",ylab="",bty="n")
box(bty="l",lwd=2)
# Add comma separator to axis labels
axis(side=2, at=axTicks(2), labels=formatC(axTicks(2), format="d", big.mark=','),las=1)
#表示するx軸ラベルを指定
# 2020- を削除。01-01 -> 1/1
labels<- sub("-","/",sub("-0","-",sub("^0","",sub("2020-","",index(data.xts)))))
# 毎月1日
labelpos<- paste0(1:12,"/",1)
for (i in labelpos){
    at<- match(i,labels)
    if (!is.na(at)){ axis(1,at=at,labels = paste0(sub("/1","",i),"月"),tck= -0.02)}
    }
#labelpos<- paste0(rep(1:12,each=2),"/",c(10,20))
#for (i in labelpos){
#    at<- match(i,labels)
#    if (!is.na(at)){ axis(1,at=at,labels = i,tck= -0.01)}
#    }
legend("topleft",inset=0.03,legend=colnames(data.xts),col=c("blue","red"),lwd=2.5,lty=1)
text(x=par("usr")[2],y=tail(data.xts,1),xpd=T,
    labels=paste0(colnames(data.xts),"\n",tail(data.xts,1),"人"))
title("大阪府 vs 東京都 : 新型コロナウイルス 人口100万人あたりの死亡者数",
    "データ:[NHK](https://www3.nhk.or.jp/n-data/opendata/coronavirus/nhk_news_covid19_prefectures_daily_data.csv)",line=3)
#dev.off()