Article Outline
Rで風配図(windrose)を作成する。
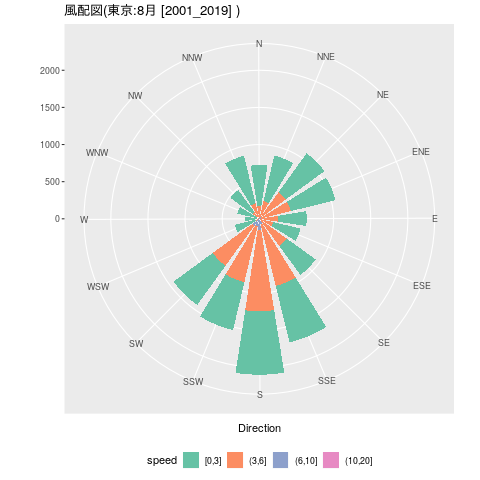
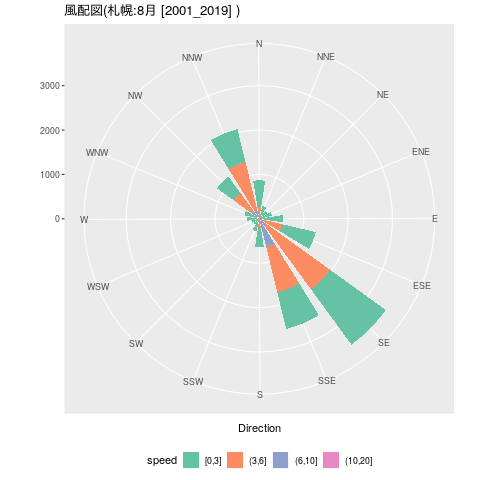
「RでWebスクレイピング05(気象庁 過去の気象データ:8月 2001〜2019)(+朝5,6,7,8時のデータ)」で得たデータを使って風配図(windrose)を作ります。
今回は、ggplot2を使います。
風向き、風速の分布
東京
風向き、風速の分布
| N | NNE | NE | ENE | E | ESE | SE | SSE | S | SSW | SW | WSW | W | WNW | NW | NNW | |
|---|---|---|---|---|---|---|---|---|---|---|---|---|---|---|---|---|
| [0,3] | 546 | 629 | 646 | 615 | 380 | 380 | 482 | 783 | 853 | 663 | 652 | 295 | 180 | 266 | 365 | 659 |
| (3,6] | 169 | 232 | 417 | 411 | 254 | 186 | 436 | 849 | 1094 | 775 | 662 | 49 | 11 | 39 | 83 | 199 |
| (6,10] | 10 | 15 | 24 | 29 | 4 | 6 | 17 | 81 | 152 | 97 | 110 | 0 | 1 | 3 | 34 | 16 |
| (10,20] | 1 | 0 | 1 | 0 | 2 | 1 | 0 | 0 | 0 | 4 | 7 | 0 | 1 | 0 | 0 | 0 |
| (20, | 0 | 0 | 0 | 0 | 0 | 0 | 0 | 0 | 0 | 0 | 0 | 0 | 0 | 0 | 0 | 0 |
風向きだけの分布
| N | NNE | NE | ENE | E | ESE | SE | SSE | S | SSW | SW | WSW | W | WNW | NW | NNW |
|---|---|---|---|---|---|---|---|---|---|---|---|---|---|---|---|
| 726 | 876 | 1088 | 1055 | 640 | 573 | 935 | 1713 | 2099 | 1539 | 1431 | 344 | 193 | 308 | 482 | 874 |
風配図(windrose)

札幌
風向き、風速の分布
| N | NNE | NE | ENE | E | ESE | SE | SSE | S | SSW | SW | WSW | W | WNW | NW | NNW | |
|---|---|---|---|---|---|---|---|---|---|---|---|---|---|---|---|---|
| [0,3] | 608 | 274 | 214 | 274 | 438 | 768 | 1541 | 844 | 432 | 197 | 125 | 149 | 248 | 305 | 463 | 754 |
| (3,6] | 252 | 22 | 7 | 21 | 99 | 520 | 1776 | 1052 | 141 | 87 | 34 | 32 | 29 | 39 | 503 | 1104 |
| (6,10] | 9 | 1 | 0 | 0 | 2 | 20 | 193 | 613 | 68 | 8 | 2 | 6 | 3 | 6 | 208 | 216 |
| (10,20] | 0 | 0 | 0 | 0 | 0 | 0 | 3 | 44 | 8 | 0 | 0 | 0 | 0 | 0 | 3 | 6 |
| (20, | 0 | 0 | 0 | 0 | 0 | 0 | 0 | 0 | 0 | 0 | 0 | 0 | 0 | 0 | 0 | 0 |
風向きだけの分布
| N | NNE | NE | ENE | E | ESE | SE | SSE | S | SSW | SW | WSW | W | WNW | NW | NNW |
|---|---|---|---|---|---|---|---|---|---|---|---|---|---|---|---|
| 869 | 297 | 221 | 295 | 539 | 1308 | 3513 | 2553 | 649 | 292 | 161 | 187 | 280 | 350 | 1177 | 2080 |
風配図(windrose)

Rコード
東京
load("Tokyo.Rdata")
block<-"東京"
weather<-Tokyo
札幌
load("Sapporo.Rdata")
block<-"札幌"
weather<-Sapporo
共通
year<-"2001_2019"
month<-"8"
#
library(ggplot2)
library(knitr)
#
ord<-c("N","NNE","NE","ENE","E","ESE","SE","SSE","S","SSW","SW","WSW","W","WNW","NW","NNW")
#
wind<-data.frame(direction=as.vector(chartr("東西南北", "EWSN",weather$wind_direction)),
    speed=as.numeric(as.vector(weather$wind_speed)))
#directionにはいっているのは方向とは限らない。"静穏"や"///"や"x"
#directionに風向きが入っているデータだけ抽出
wind<- subset(wind,direction=="N"|direction=="NNE"|direction=="NE"|direction=="ENE"|direction=="E"|direction=="ESE"|direction=="SE"|direction=="SSE"|direction=="S"|direction=="SSW"|direction=="SW"|direction=="WSW"|direction=="W"|direction=="WNW"|direction=="NW"|direction=="NNW")
#
wind$direction<- factor(wind$direction,levels=ord)
#
#ダミーのデータ(すべての方向、風速は欠損値)を結合する。
dummy<-data.frame(direction=levels(wind$direction),speed=rep(NA,16))
newwind<-rbind(wind[,c("direction","speed")],dummy)
newwind$direction<- factor(newwind$direction,levels=ord)
# NA を含む行を削除する
newwind<-na.omit(newwind)
#
newwind$cut<-cut(newwind$speed,breaks=c(0,3,6,10,20,100),labels=c("[0,3]","(3,6]","(6,10]","(10,20]" ,"(20,  ") ,right =TRUE, include.lowest = TRUE)
#
## 風向き、風速の分布
kable(table(newwind$cut,newwind$direction))
#
## 風向きだけの分布
kable(t(apply(table(newwind$cut,newwind$direction),2,sum)))
#
## 風配図(windrose)を作成
#png("windroseT08.png")
#png("windroseS08.png")
ggplot(newwind, aes(x =factor(direction),fill = cut)) + geom_bar(width =0.8) + coord_polar(theta = "x",start = -0.2) +
     scale_fill_brewer(palette = "Set2") +
     theme(legend.position="bottom")+
     labs(fill = "speed",x="Direction",y="",title=paste0("風配図(",block,":",month,"月 [",year,"] )"))
#dev.off()