Article Outline
R : igraphでフローチャート
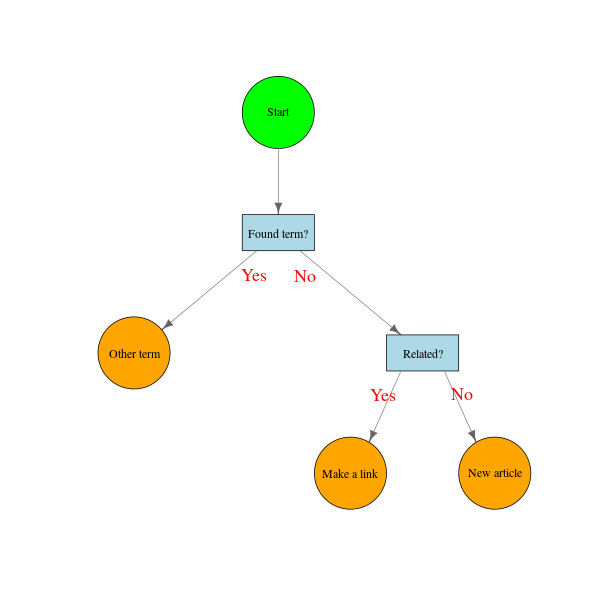
layoutパラメータにx,y座標の行列を与えるとよい。
diagram::coordinatesでvertexの大まかな位置行列を作成してから調整。

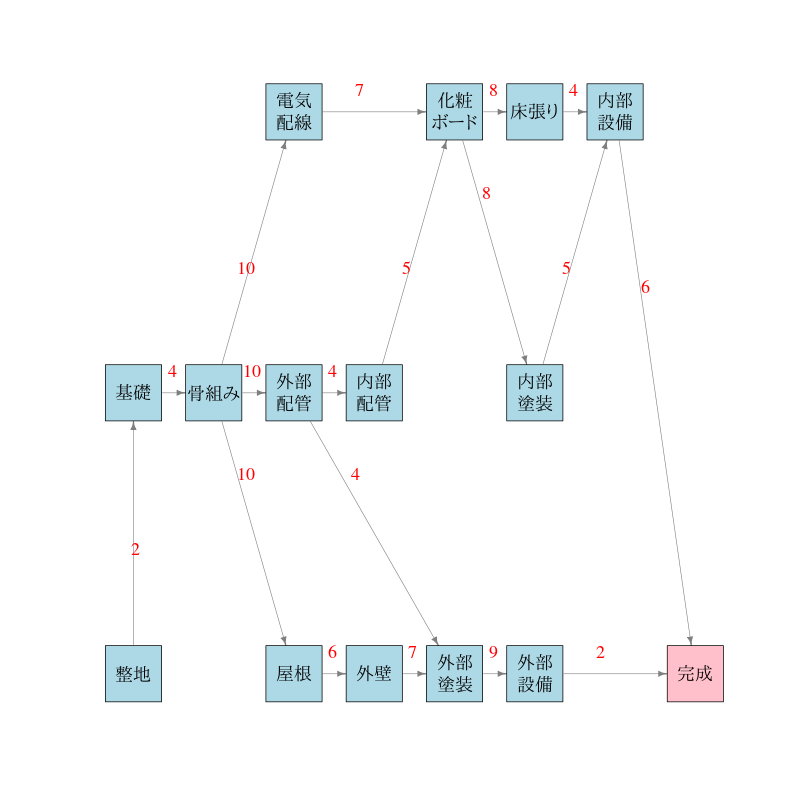
PERT/CPMの例題
手入力で位置行列を作成

開始時刻、余裕時間の表
| id | 作業名 | 作業時間 | 最早開始時刻 | 最早完了時刻 | 最遅開始時刻 | 最遅完了時刻 | 全余裕時間 | 自由余裕時間 |
|---|---|---|---|---|---|---|---|---|
| a | 整地 | 2 | 0 | 2 | 0 | 2 | 0 | 0 |
| b | 基礎 | 4 | 2 | 6 | 2 | 6 | 0 | 0 |
| c | 骨組み | 10 | 6 | 16 | 6 | 16 | 0 | 0 |
| d | 電気配線 | 7 | 16 | 23 | 18 | 25 | 2 | 2 |
| e | 外部配管 | 4 | 16 | 20 | 16 | 20 | 0 | 0 |
| f | 内部配管 | 5 | 20 | 25 | 20 | 25 | 0 | 0 |
| g | 屋根 | 6 | 16 | 22 | 20 | 26 | 4 | 0 |
| h | 外壁 | 7 | 22 | 29 | 26 | 33 | 4 | 0 |
| i | 化粧ボード | 8 | 25 | 33 | 25 | 33 | 0 | 0 |
| j | 外部塗装 | 9 | 29 | 38 | 33 | 42 | 4 | 0 |
| k | 床張り | 4 | 33 | 37 | 34 | 38 | 1 | 1 |
| l | 内部塗装 | 5 | 33 | 38 | 33 | 38 | 0 | 0 |
| m | 外部設備 | 2 | 38 | 40 | 42 | 44 | 4 | 4 |
| n | 内部設備 | 6 | 38 | 44 | 38 | 44 | 0 | 0 |
| Fin | 完成 | 0 | 44 | 44 | 44 | 44 | 0 | 0 |
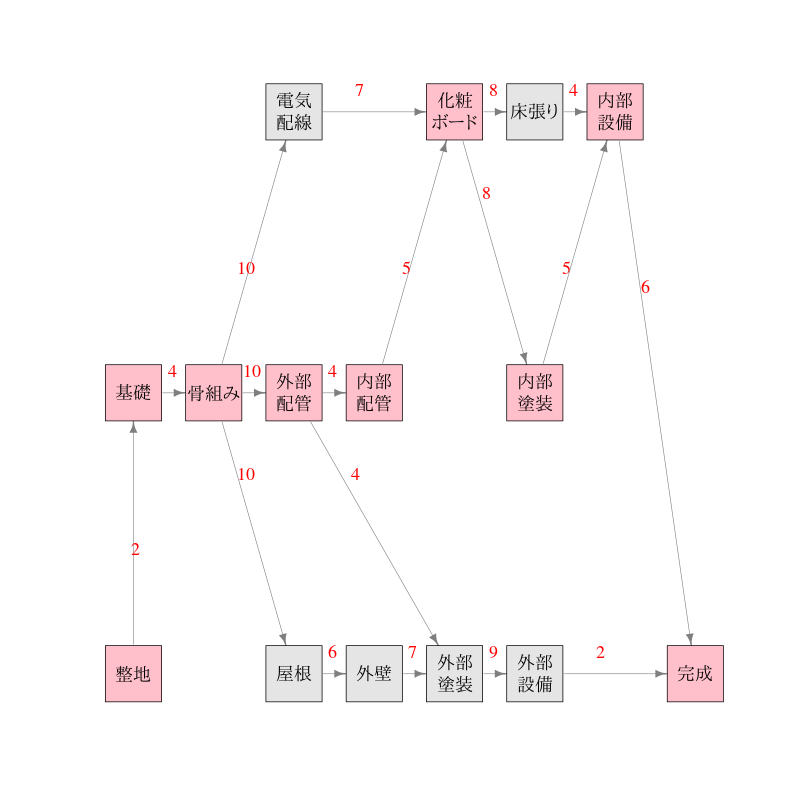
クリティカルパス上の作業に色付け

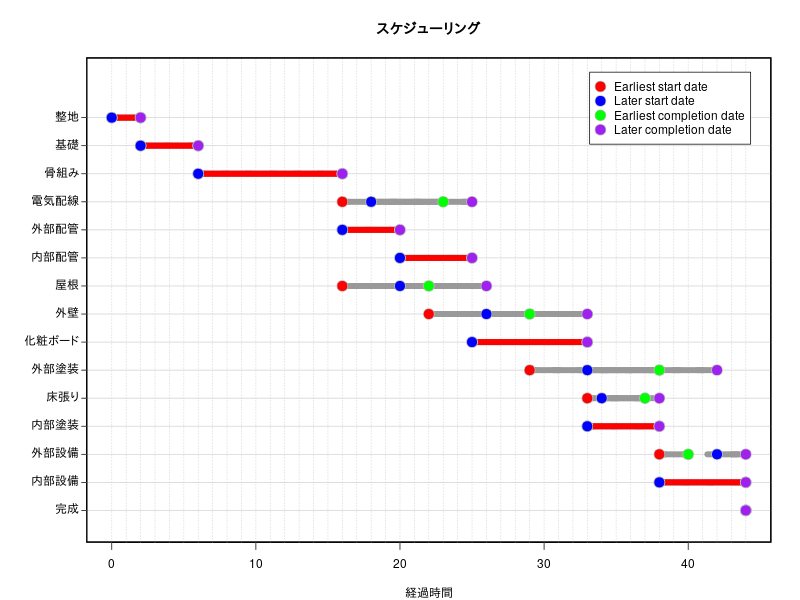
(おまけ)スケジュール

Rコード
diagram::coordinatesでvertexの大まかな位置行列を作成してから調整。
edge label位置はスペースと改行で調整
library(igraph)
library(diagram)
# 隣接行列を作成
project<-cbind(
    c(0,0,0,0,0,0),
    c(1,0,0,0,0,0),
    c(0,1,0,0,0,0),
    c(0,1,0,0,0,0),
    c(0,0,0,1,0,0),
    c(0,0,0,1,0,0))
# グラフオブジェクトに変換
g<-graph.adjacency(project)
#
# diagram::coordinatesでvertexの大まかな位置行列を作成
# もちろん、手入力で位置行列を作成してもよい。
pos <- coordinates(c(1,1,2,2))
# プロットしてみて位置を調整する場所を確認する。
#plot(g,edge.label=c("","Yes","No","Yes","No"),layout=pos,edge.arrow.size=0.6)
#
vertex.label<-c("Start","Found term?","Other term","Related?","Make a link","New article")
shape<-c("circle","rectangle","circle","rectangle","circle","circle")
vertex.color<-c("green","lightblue","orange","lightblue","orange","orange")
# vertex位置調整
pos[5,1]<-(pos[2,1]+pos[4,1])/2
pos[6,1]<-pos[6,1]+(pos[4,1]-pos[5,1])
# スペース、改行(\n)を用いてedge label位置調整
edge.label=c("","\n\nYes","\n\nNo","Yes   ","   No")
#
# png("flowc01.png",width=600,height=600)
plot(g,vertex.shape=shape,vertex.size=40,vertex.size2=20,vertex.color=vertex.color,
    vertex.label.color="black",vertex.label=vertex.label,
    edge.label=edge.label,edge.arrow.size=0.8,edge.arrow.width=1,
    edge.width=0.8,    edge.color="gray40",edge.label.cex = 1.5,edge.label.color = "red",
    layout=pos)
# dev.off()
手入力で位置行列を作成
PERT/CPMの例題を使わせていただきます。
vertex.label:長めなのは改行(\n)を入れて二行にする。
library(igraph)
# 隣接行列を作成
project<-rbind(
    c(0,1,0,0,0,0,0,0,0,0,0,0,0,0,0),
    c(0,0,1,0,0,0,0,0,0,0,0,0,0,0,0),
    c(0,0,0,1,1,0,1,0,0,0,0,0,0,0,0),
    c(0,0,0,0,0,0,0,0,1,0,0,0,0,0,0),
    c(0,0,0,0,0,1,0,0,0,1,0,0,0,0,0),
    c(0,0,0,0,0,0,0,0,1,0,0,0,0,0,0),
    c(0,0,0,0,0,0,0,1,0,0,0,0,0,0,0),
    c(0,0,0,0,0,0,0,0,0,1,0,0,0,0,0),
    c(0,0,0,0,0,0,0,0,0,0,1,1,0,0,0),
    c(0,0,0,0,0,0,0,0,0,0,0,0,1,0,0),
    c(0,0,0,0,0,0,0,0,0,0,0,0,0,1,0),
    c(0,0,0,0,0,0,0,0,0,0,0,0,0,1,0),
    c(0,0,0,0,0,0,0,0,0,0,0,0,0,0,1),
    c(0,0,0,0,0,0,0,0,0,0,0,0,0,0,1),
    c(0,0,0,0,0,0,0,0,0,0,0,0,0,0,0))
duration<-c(2,4,10,7,4,5,6,7,8,9,4,5,2,6,0)
## 隣接行列 -> graph obj
g<-graph.adjacency(project*duration,weighted=T)
#
# layoutを行列で与える
position<-cbind(c(0,0,1,2,2,3,2,3,4,4,5,5,5,6,7),
            c(0,1,1,2,1,1,0,0,2,0,2,1,0,2,0))
vertex.label<-c("整地","基礎","骨組み","電気\n配線","外部\n配管","内部\n配管","屋根","外壁",
    "化粧\nボード","外部\n塗装","床張り","内部\n塗装","外部\n設備","内部\n設備","完成")
#
# png("flowc02.png",width=800,height=800)
plot(g,vertex.shape="rectangle",vertex.size=20,vertex.size2=20,vertex.color=c(rep("lightblue",14),"pink"),
    vertex.label=vertex.label,vertex.label.color="black",vertex.label.cex =1.5,
    edge.label=paste0(" ",E(g)$weight,"\n\n"),edge.arrow.size=0.6,edge.arrow.width=1,
    edge.width=0.8,    edge.color="gray50",edge.label.cex = 1.5,edge.label.color = "red",
    layout=position)
# dev.off()
開始時刻、余裕時間の表
library(ProjectManagement)
library(knitr)
schedule<-schedule.pert(duration,project,PRINT =F)
schedule[1]
dat<-schedule[[2]]
id<- c(letters[1:14],"Fin")
name<-c("整地","基礎","骨組み","電気配線","外部配管","内部配管","屋根","外壁",
    "化粧ボード","外部塗装","床張り","内部塗装","外部設備","内部設備","完成")

df<-data.frame(id=id,作業名=name,作業時間=dat[,2],最早開始時刻=dat[,3],最早完了時刻=dat[,5],最遅開始時刻=dat[,4],最遅完了時刻=dat[,6],
    全余裕時間=dat[,7],自由余裕時間=dat[,8])
kable(df)
クリティカルパス上の作業に色付け
# 全余裕時間
# 0の作業がクリティカルパス上の作業
TF<-dat[,7]
# 1:クリティカルパス上の作業 0:それ以外の作業にする。
TF[TF>0]<- -1
TF<- TF + 1
# vertex.color 1:pink 0:gray90
vertex.color<-gsub("0","gray90",gsub("1","pink",TF))
# png("flowc03.png",width=800,height=800)
plot(g,vertex.shape="rectangle",vertex.size=20,vertex.size2=20,vertex.color=vertex.color,
    vertex.label=vertex.label,vertex.label.color="black",vertex.label.cex =1.5,
    edge.label=paste0(" ",E(g)$weight,"\n\n"),edge.arrow.size=0.8,edge.arrow.width=1,
    edge.width=0.8,    edge.color="gray50",edge.label.cex = 1.5,edge.label.color = "red",
    layout=position)
# dev.off()
(おまけ)スケジュール
bg=c("red","blue","green","purple")
linecol="gray60"
# png("flowc04.png",width=800,height=600)
par(mar=c(4,6,4,2),xpd=F)
plot(x=dat[,6],y=dat[,1],xlim=c(0,max(dat[,6])),ylim=c(0.5,max(dat[,1])*1.1),type="n",yaxt="n",xlab="経過時間",ylab="")
axis(2,at=seq(1,nrow(dat)),labels=F,tck=-0.01)
abline(h=dat[,1],lwd=1,col="lightgray")
abline(v=seq(0,max(dat[,6]),1),lwd=1,col="lightgray",lty=3)
segments(x0=dat[,3],x1=dat[,6],y0=rev(dat[,1]),col=linecol,lwd=8,lty=3)
segments(x0=dat[,3],x1=dat[,5],y0=rev(dat[,1]),col=linecol,lwd=8,lty=1)
segments(x0=dat[,4],x1=dat[,6],y0=rev(dat[,1]),col=linecol,lwd=8,lty=1)
for (i in 1:nrow(dat)){
    if (dat[i,3]==dat[i,4]){
            segments(x0=dat[i,3],x1=dat[i,5],y0=abs(i-nrow(dat))+1 ,col="red",lwd=8,lty=1)
                }
}
points(x=dat[,3],y=rev(dat[,1]),pch=21,bg=bg[1],col="gray",cex=2)
points(x=dat[,4],y=rev(dat[,1]),pch=21,bg=bg[2],col="gray",cex=2)
points(x=dat[,5],y=rev(dat[,1]),pch=21,bg=bg[3],col="gray",cex=2)
points(x=dat[,6],y=rev(dat[,1]),pch=21,bg=bg[4],col="gray",cex=2)
text(x=par("usr")[1],y=rev(dat[,1]),label=name,pos=2,xpd=T)
title("スケジューリング")
legend("topright",pch=21,pt.cex=2,col="gray",pt.bg=bg,legend=colnames(dat)[3:6],inset=c(0.03,0.03),yjust=1.2)
rect(xleft=par("usr")[1], ybottom=par("usr")[3], xright=par("usr")[2], ytop=par("usr")[4],lwd=3)
# dev.off()