Article Outline
PCR検査者数の比較(ourworldindata)
ourworldindata.org のデータを使います。
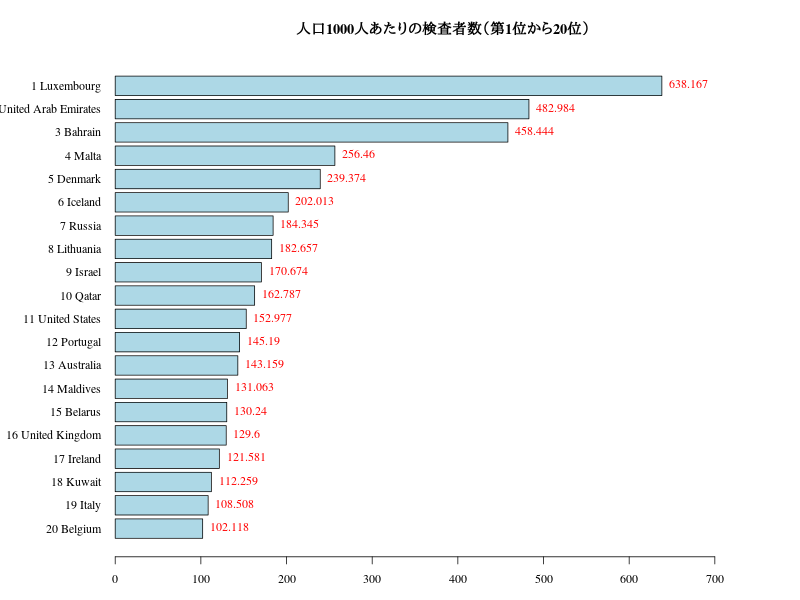
1位〜20位

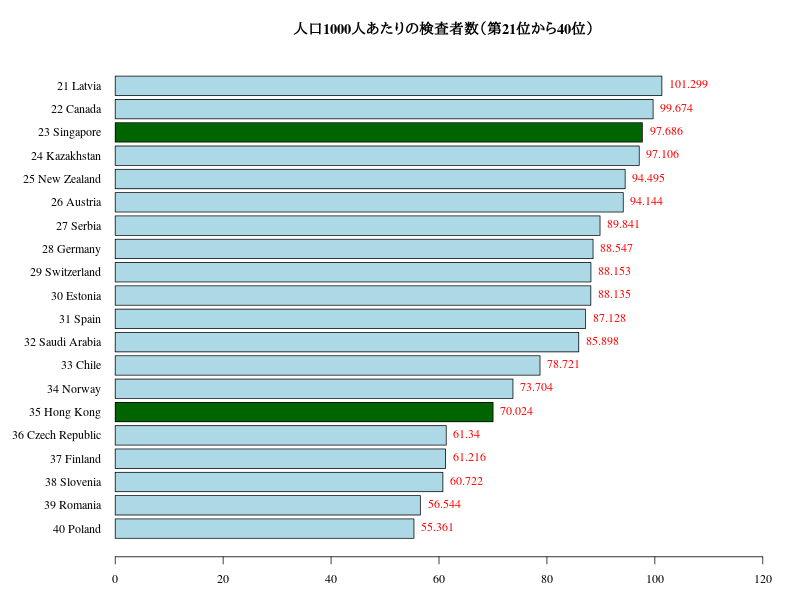
21位〜40位

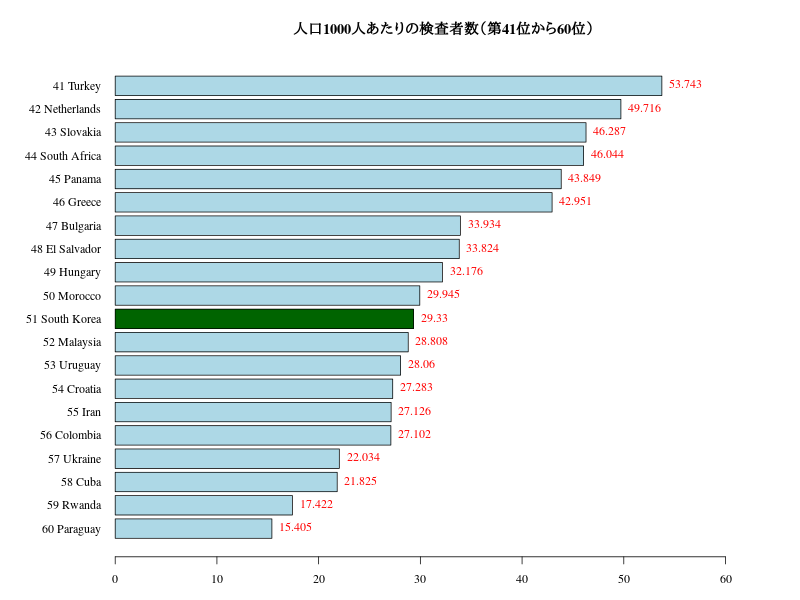
41位〜60位

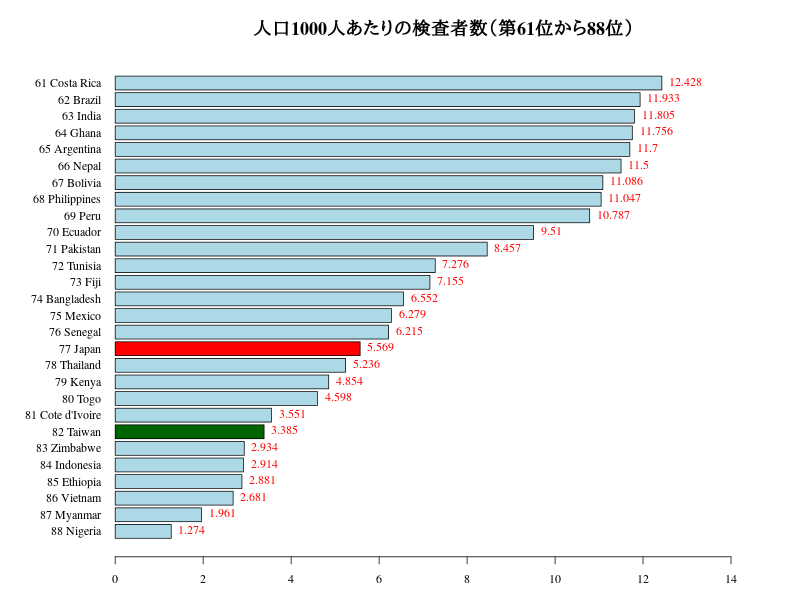
61位〜88位(日本はここ!)

Rコード
#データ読み込み
test<- read.csv("https://covid.ourworldindata.org/data/owid-covid-data.csv")
save(test,file="test.Rdata")
#load("test.Rdata")
dat<- test[,c("date","location","total_tests_per_thousand")]
# total_tests_per_thousandがNAではないものを抽出
dat<- dat[!is.na(dat[,3]),]
# 国ごとの最新のトータル検査者数(maxデータ)
dat<- aggregate(dat$total_tests_per_thousand,max,na.rm=T, by=list(dat$location))
# ネーム変更
colnames(dat)<- c("location","total_tests_per_thousand")
# 並べ替え
dat<- dat[order(dat$total_tests_per_thousand),]
rownames(dat)<- nrow(dat):1
# ランクごとに分ける
dat01<- dat[(nrow(dat)-19):nrow(dat),]
dat02<- dat[(nrow(dat)-39):(nrow(dat)-20),]
dat03<- dat[(nrow(dat)-59):(nrow(dat)-40),]
dat04<- dat[1:(nrow(dat)-60),]
#
# 1〜20
#png("pcrtest01.png",width=800,height=600)
par(mar=c(3,8,4,2),family="serif")
b<- barplot(dat01$total_tests_per_thousand,names=paste(rownames(dat01),dat01$location),col="lightblue",las=1,horiz=T,
    xlim=c(0,max(dat01$total_tests_per_thousand)*1.2))
text(x=dat01$total_tests_per_thousand,y=b,labels=dat01$total_tests_per_thousand,col="red",pos=4)
title("人口1000人あたりの検査者数(第1位から20位)")
#dev.off()
# 21〜40
col<- ifelse(is.element(dat02$location,c("Singapore","Hong Kong")),"darkgreen","lightblue")
#png("pcrtest02.png",width=800,height=600)
par(mar=c(3,8,4,2),family="serif")
b<- barplot(dat02$total_tests_per_thousand,names=paste(rownames(dat02),dat02$location),col=col,las=1,horiz=T,
    xlim=c(0,max(dat02$total_tests_per_thousand)*1.2))
text(x=dat02$total_tests_per_thousand,y=b,labels=dat02$total_tests_per_thousand,col="red",pos=4)
title("人口1000人あたりの検査者数(第21位から40位)")
#dev.off()
# 41〜60
col<- ifelse(is.element(dat03$location,"South Korea"),"darkgreen","lightblue")
#png("pcrtest03.png",width=800,height=600)
par(mar=c(3,8,4,2),family="serif")
b<- barplot(dat03$total_tests_per_thousand,names=paste(rownames(dat03),dat03$location),col=col,las=1,horiz=T,
    xlim=c(0,max(dat03$total_tests_per_thousand)*1.2))
text(x=dat03$total_tests_per_thousand,y=b,labels=dat03$total_tests_per_thousand,col="red",pos=4)
title("人口1000人あたりの検査者数(第41位から60位)")
#dev.off()
# 61〜8*
col<- ifelse(is.element(dat04$location,"Japan"),"red","lightblue")
col[grep("Taiwan",dat04$location)]<- "darkgreen"
#png("pcrtest04.png",width=800,height=600)
par(mar=c(3,8,4,2),family="serif")
b<- barplot(dat04$total_tests_per_thousand,names=paste(rownames(dat04),dat04$location),col=col,las=1,horiz=T,
    xlim=c(0,max(dat04$total_tests_per_thousand)*1.2))
text(x=dat04$total_tests_per_thousand,y=b,labels=dat04$total_tests_per_thousand,col="red",pos=4)
title(paste0("人口1000人あたりの検査者数(第61位から",nrow(dat),"位)"),cex.main=1.5)
#dev.off()