Article Outline
Rで折れ線グラフ、棒グラフ (新型コロナウイルス:Coronavirus)
ちょっと工夫した折れ線グラフ、棒グラフを作りました。
新型コロナウイルスの感染状況
米ジョンズ・ホプキンス大学の新型コロナウイルスの感染状況をまとめたWebサイト
Coronavirus 2019-nCoV Global Cases by Johns Hopkins CSSE
データはGitHubから入手できます。
2019 Novel Coronavirus COVID-19 (2019-nCoV) Data Repository by Johns Hopkins CSSE
使用するデータ(3/22からファイル場所、名前変更)
CSSE COVID-19 Dataset
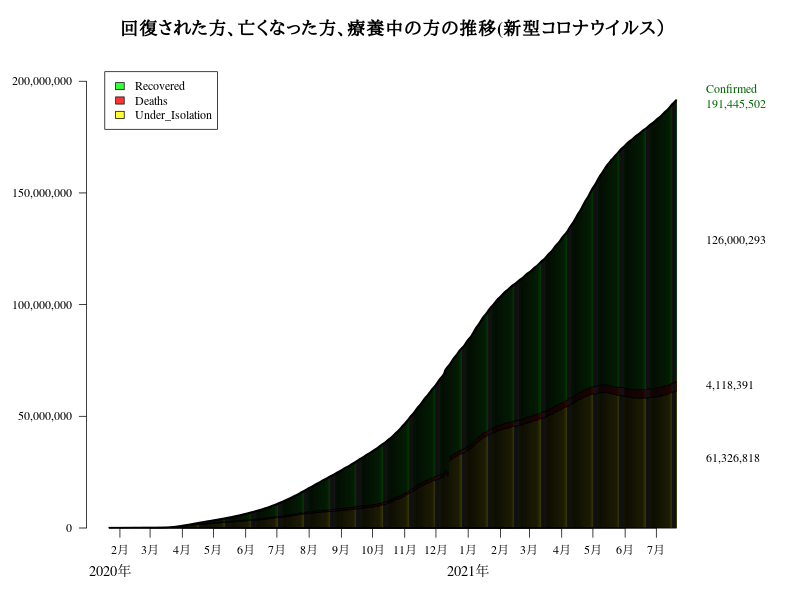
新型コロナウイルスに感染された方、回復された方、亡くなった方の数の推移(日別)
y軸のラベルの数値にコンマをつけ、x軸のラベルを選択して表示
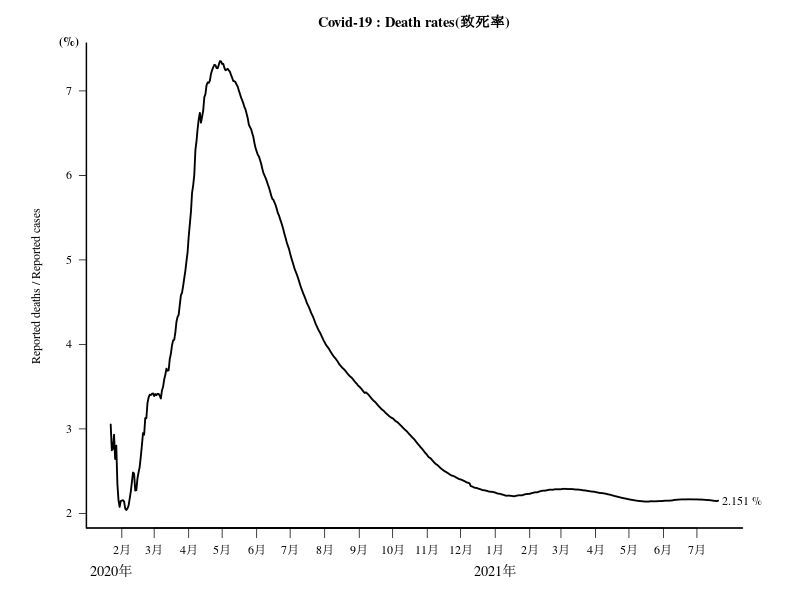
致死率(%):Deaths/Confirmed の推移
(%)の表示をy軸の上部に配置、x軸のラベルを選択して22 Jan.のように表示
死亡者数900人以上の国の死亡者数(表)
| 7/2/20 | |
|---|---|
| US | 128740 |
| Brazil | 61884 |
| United Kingdom | 44080 |
| Italy | 34818 |
| France | 29878 |
| Mexico | 29189 |
| Spain | 28368 |
| India | 18213 |
| Iran | 11106 |
| Peru | 10045 |
| Belgium | 9761 |
| Russia | 9668 |
| Germany | 9006 |
| Canada | 8700 |
| Netherlands | 6132 |
| Chile | 5920 |
| Sweden | 5411 |
| Turkey | 5167 |
| China | 4641 |
| Ecuador | 4639 |
| Pakistan | 4551 |
| Colombia | 3650 |
| Egypt | 3120 |
| Indonesia | 2987 |
| South Africa | 2844 |
| Iraq | 2160 |
| Switzerland | 1965 |
| Bangladesh | 1926 |
| Saudi Arabia | 1752 |
| Ireland | 1738 |
| Romania | 1687 |
| Portugal | 1587 |
| Poland | 1492 |
| Argentina | 1385 |
| Philippines | 1274 |
| Bolivia | 1271 |
| Ukraine | 1200 |
| Japan | 977 |
| Algeria | 928 |
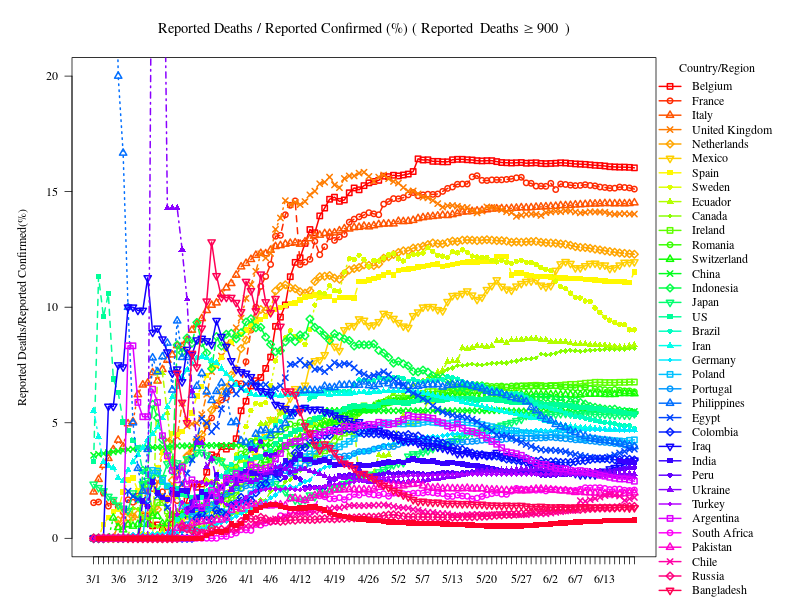
死亡者数900人以上の国の致死率(%):Deaths/Confirmed の推移
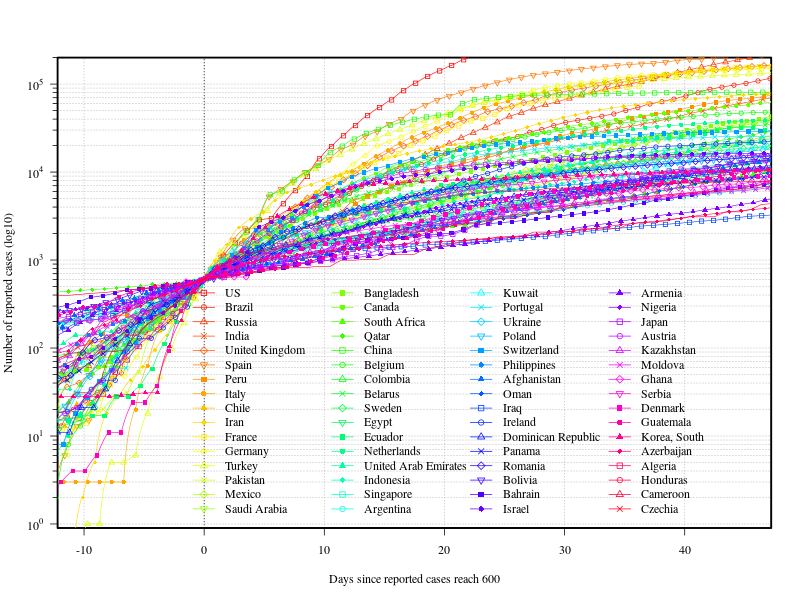
報告された感染者数が一定数超えた時点を起点とした折れ線グラフ
片対数グラフ(Semi-log plot)
(参考)Alessandro Strumia(physicist) Twitter:Days since reported cases reach 200
Days since reported cases reach 600
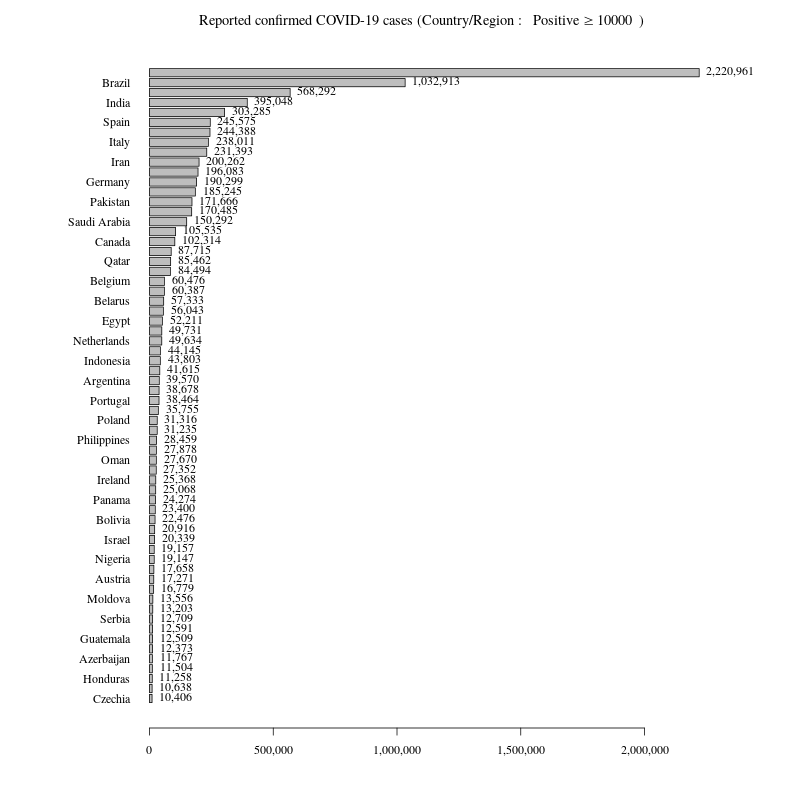
報告された感染者数が10000人以上の国ごとの感染者数の棒グラフ
x軸のラベルの数値にコンマ、国ごとの値をグラフ右に表記
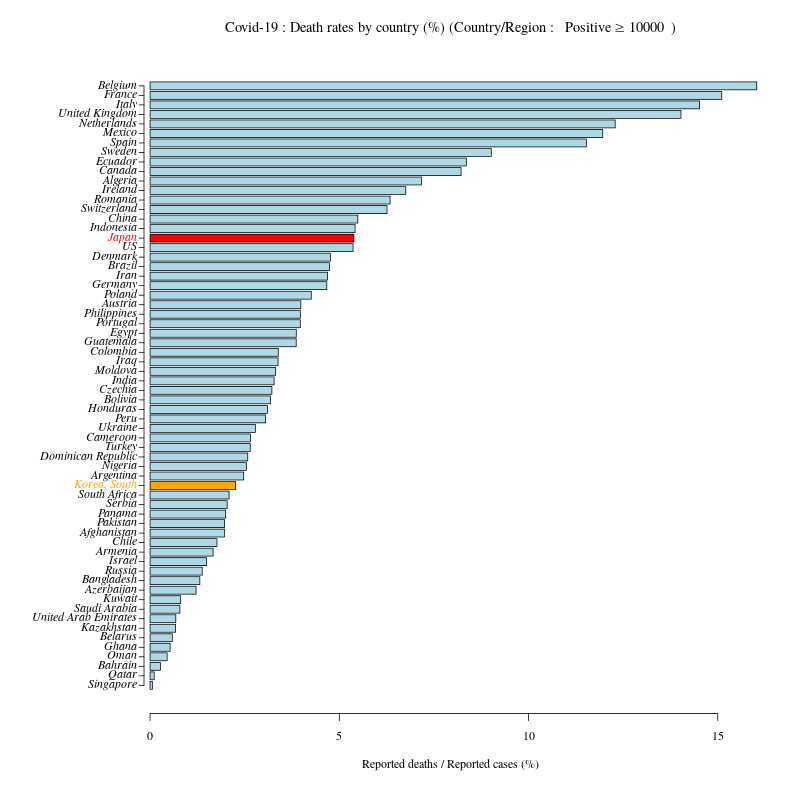
報告された感染者数が10000人以上の国ごとの致死率の棒グラフ
日本と韓国のグラフの色、ラベルの色を変えた。
報告された感染者数 / 人口 * 100 (タイトルにbquote関数を使う)
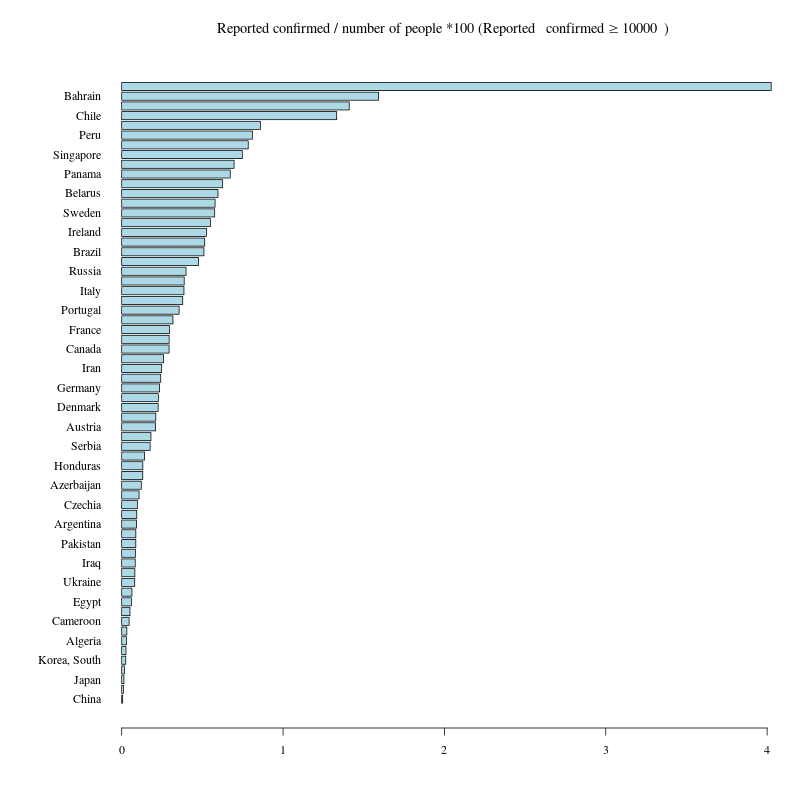
| country | pop | population_density | Confirmed | Confirmed_per_Pop |
|---|---|---|---|---|
| China | 1355692576 | 141.26 | 84830 | 0.006257 |
| Japan | 127103388 | 336.33 | 19055 | 0.014992 |
| Nigeria | 177155754 | 191.78 | 27110 | 0.015303 |
| Indonesia | 253609643 | 133.16 | 59394 | 0.023419 |
| Korea, South | 49039986 | 491.78 | 12967 | 0.026442 |
| Philippines | 107668231 | 358.89 | 38805 | 0.036041 |
| Algeria | 38813722 | 16.30 | 14657 | 0.037762 |
| Morocco | 32987206 | 73.87 | 12969 | 0.039315 |
| Nepal | 30986975 | 210.54 | 14519 | 0.046855 |
| India | 1236344631 | 376.10 | 625544 | 0.050596 |
| Cameroon | 23130708 | 48.65 | 12592 | 0.054438 |
| Ghana | 25758108 | 107.99 | 18134 | 0.070401 |
| Egypt | 86895099 | 86.77 | 71299 | 0.082052 |
| Poland | 38346279 | 122.64 | 35146 | 0.091654 |
| Bangladesh | 166280712 | 1154.74 | 153277 | 0.092180 |
| Afghanistan | 31822848 | 48.79 | 32022 | 0.100626 |
| Ukraine | 44291413 | 73.38 | 46821 | 0.105711 |
| Pakistan | 196174380 | 246.42 | 221896 | 0.113112 |
| Czechia | 10627448 | 134.75 | 12178 | 0.114590 |
| Romania | 21729871 | 91.15 | 27746 | 0.127686 |
| Guatemala | 14647083 | 134.51 | 20072 | 0.137038 |
| Argentina | 43024374 | 15.47 | 69941 | 0.162561 |
| Iraq | 32585692 | 74.34 | 53708 | 0.164821 |
| Azerbaijan | 9686210 | 111.85 | 18684 | 0.192893 |
| Mexico | 120286655 | 61.23 | 238511 | 0.198286 |
| Serbia | 7209764 | 93.06 | 15195 | 0.210756 |
| Austria | 8223062 | 98.04 | 17941 | 0.218179 |
| Colombia | 46245297 | 40.60 | 102261 | 0.221127 |
| Denmark | 5569077 | 129.23 | 13015 | 0.233701 |
| Kazakhstan | 17948816 | 6.59 | 42574 | 0.237197 |
| Germany | 80996685 | 226.87 | 196370 | 0.242442 |
| Honduras | 8598561 | 76.71 | 21120 | 0.245622 |
| Turkey | 81619392 | 104.16 | 202284 | 0.247838 |
| Iran | 80840713 | 49.05 | 232863 | 0.288052 |
| Netherlands | 16877351 | 406.26 | 50546 | 0.299490 |
| Canada | 34834841 | 3.49 | 106643 | 0.306139 |
| France | 66259012 | 102.92 | 203640 | 0.307339 |
| Dominican Republic | 10349741 | 212.65 | 34197 | 0.330414 |
| Bolivia | 10631486 | 9.68 | 35528 | 0.334177 |
| Israel | 7821850 | 376.59 | 27047 | 0.345788 |
| South Africa | 48375645 | 39.68 | 168061 | 0.347408 |
| Ecuador | 15654411 | 55.21 | 59468 | 0.379880 |
| Italy | 61680122 | 204.69 | 240961 | 0.390662 |
| Portugal | 10813834 | 117.43 | 42782 | 0.395623 |
| Switzerland | 8061516 | 195.30 | 31967 | 0.396538 |
| United Kingdom | 63742977 | 261.66 | 285285 | 0.447555 |
| Russia | 142470272 | 8.33 | 660231 | 0.463417 |
| Moldova | 3583288 | 105.85 | 17150 | 0.478611 |
| Spain | 47737941 | 94.46 | 250103 | 0.523908 |
| Ireland | 4832765 | 68.77 | 25489 | 0.527421 |
| Belgium | 10449361 | 342.29 | 61598 | 0.589491 |
| Belarus | 9608058 | 46.28 | 62698 | 0.652556 |
| Saudi Arabia | 27345986 | 12.72 | 197608 | 0.722622 |
| Sweden | 9723809 | 21.59 | 70639 | 0.726454 |
| Brazil | 202656788 | 23.80 | 1496858 | 0.738617 |
| Singapore | 5567301 | 7987.52 | 44310 | 0.795897 |
| US | 318892103 | 32.45 | 2741180 | 0.859595 |
| Armenia | 3060631 | 102.90 | 26658 | 0.870997 |
| United Arab Emirates | 5628805 | 67.33 | 49469 | 0.878854 |
| Peru | 30147935 | 23.46 | 292004 | 0.968570 |
| Panama | 3608431 | 47.84 | 35237 | 0.976519 |
| Oman | 3219775 | 10.40 | 42555 | 1.321676 |
| Chile | 17363894 | 22.97 | 284541 | 1.638693 |
| Kuwait | 2742711 | 153.93 | 47859 | 1.744952 |
| Bahrain | 1314089 | 1729.06 | 27837 | 2.118350 |
| Qatar | 2123160 | 183.25 | 97897 | 4.610910 |
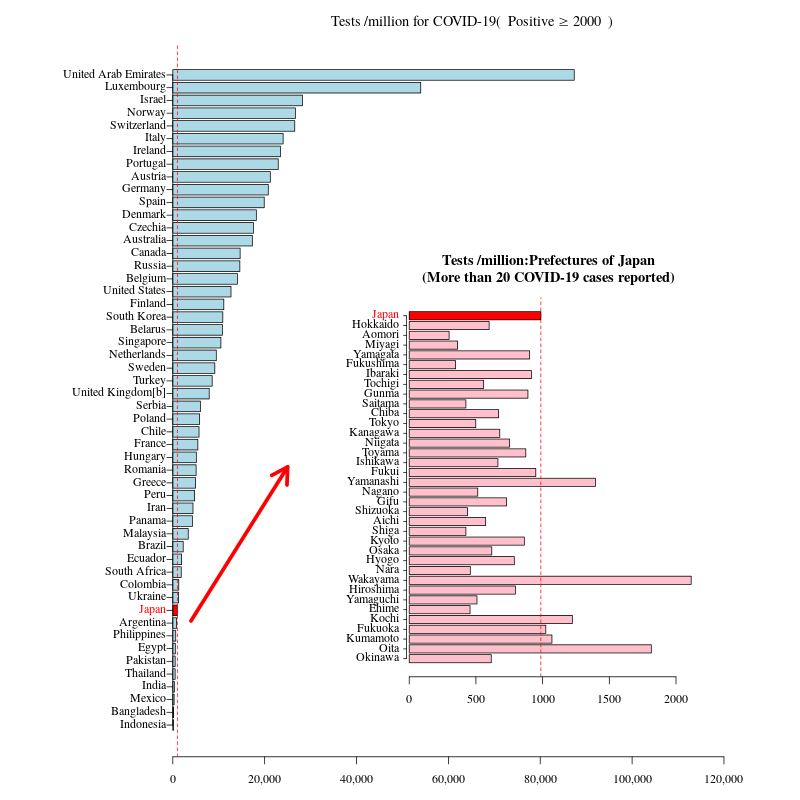
日本の人口あたり(報告された!!)感染者が少ないのは検査しないから。
R code : 韓国と日本のPCR検査実施人数比較 (新型コロナウイルス:Coronavirus)
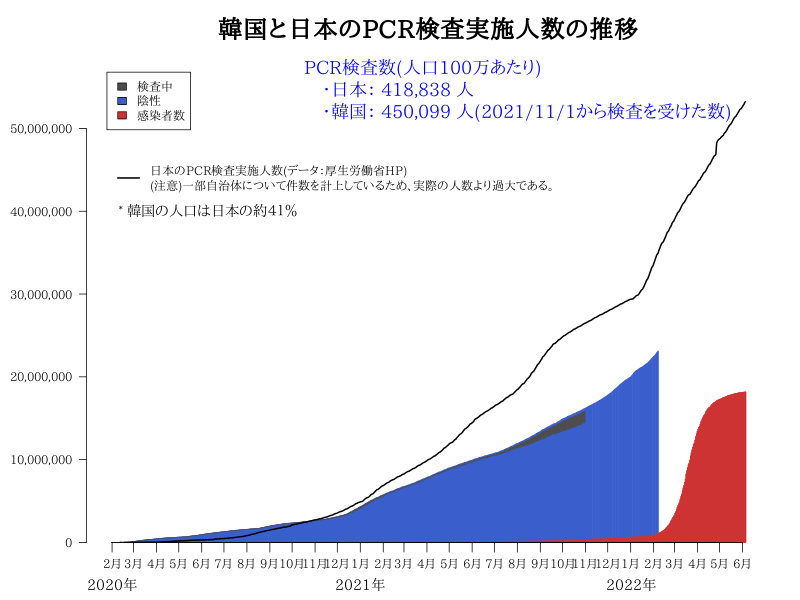
Plot in Plot
Rコード
データをGitHubから入手。(read.csvの際には、check.names=Fをつける)
# read.csvの際には、check.names=Fをつける
url<- "https://raw.githubusercontent.com/CSSEGISandData/COVID-19/master/csse_covid_19_data/csse_covid_19_time_series/time_series_covid19_confirmed_global.csv"
Confirmed<- read.csv(url,check.names=F)
url<- "https://raw.githubusercontent.com/CSSEGISandData/COVID-19/master/csse_covid_19_data/csse_covid_19_time_series/time_series_covid19_deaths_global.csv"
Deaths<- read.csv(url,check.names=F)
url<- "https://raw.githubusercontent.com/CSSEGISandData/COVID-19/master/csse_covid_19_data/csse_covid_19_time_series/time_series_covid19_recovered_global.csv"
Recovered<- read.csv(url,check.names=F)
#save(Confirmed,file="Confirmed.Rdata") ; save(Recovered,file="Recovered.Rdata") ; save(Deaths,file="Deaths.Rdata")
全世界の日毎の合計:Confirmed , Deaths, Recovered 別
# Confirmed , Deaths, Recoveredのデータ数が違うことがある。
# rbindを使うと不具合あり。もしくはエラーとなる。
nCoV1<-colSums(Confirmed[,5:ncol(Confirmed)])
nCoV2<-colSums(Deaths[,5:ncol(Deaths)])
nCoV3<-colSums(Recovered[,5:ncol(Recovered)])
lenmax<- max(c(length(nCoV1),length(nCoV2),length(nCoV3)))
nCoV<-matrix(NA,nrow=3,ncol=lenmax)
nCoV[1,1:length(nCoV1)]<- nCoV1
nCoV[2,1:length(nCoV2)]<- nCoV2
nCoV[3,1:length(nCoV3)]<- nCoV3
rownames(nCoV)<- c("Confirmed","Deaths","Recovered")
colnames(nCoV)<- names(nCoV1)
感染者、回復された方、亡くなった方の数の推移(日別)
旧
# 指数表示を抑制
options(scipen=2)
#png("Coronavirus001.png",width=800,height=600)
par(mar=c(5,6,3,6),family="serif")
matplot(t(nCoV),type="o",col=1:3,lwd=1.5,lty=1:3,pch=16:18,las=1,xaxt="n",yaxt="n",xlab="",ylab="",bty="l")
box(bty="l",lwd=2)
#axis(1,at=1:ncol(nCoV), labels =sub("/20","",colnames(nCoV)))
#表示するx軸ラベルを指定
axis(1,at=1:ncol(nCoV), labels =NA,tck= -0.01)
labels<-sub("/20","",colnames(nCoV))
#labelpos<- c("2/1","2/10","2/20","3/1","3/10","3/20")
labelpos<- paste0(rep(1:12,each=3),"/",c(1,10,20))
axis(1,at=1,labels =labels[1],tick=F)
for (i in labelpos){
    at<- match(i,labels)
    if (!is.na(at)){ axis(1,at=at,labels = i,tck= -0.02)}
    }
# Add comma separator to axis labels
axis(side=2, at=axTicks(2), labels=formatC(axTicks(2), format="d", big.mark=','),las=1)
legend("topleft", legend = rownames(nCoV),col=1:3,lwd=1.5,lty=1:3,pch=16:18,inset =c(0.02,0.03))
text(x=par("usr")[2],y=apply(nCoV,1,max,na.rm=T),xpd=T,pos=3,
    labels=formatC(apply(nCoV,1,max,na.rm=T), format="d", big.mark=','),cex=1.5)
title("Coronavirus [ Total Confirmed,Total Recovered,Total Deaths ]")
#dev.off()
新
# 指数表示を抑制
options(scipen=2)
#
XY <- data.frame(Under_Isolation=nCoV[1,]-(nCoV[2,] + nCoV[3,]), Deaths=nCoV[2,], Recovered=nCoV[3,])
rownames(XY)<- sub("/20","",colnames(nCoV))
#png("Coronavirus001.png",width=800,height=600)
par(mar=c(5,6,4,7),family="serif")
b<- barplot(t(XY),col=c(rgb(1,1,0,0.8),rgb(1,0,0,0.8),rgb(0,1,0,0.8)),yaxt="n",ylim=c(0,max(nCoV[1,],na.rm=T)*1.1),xaxt="n",
    legend=T,args.legend=list(x="topleft",inset=0.03))
lines(x=b,y=nCoV[1,],lwd=3)
#表示するx軸ラベルを指定
#axis(1,at=b[1]:b[nrow(XY)], labels =NA,tck= -0.01)
labels<- rownames(XY)
#axis(1,at=b[1],labels =labels[1],tick=F)
labelpos<- paste0(rep(1:12,each=3),"/",1)
for (i in labelpos){
    at<- b[match(i,labels)]
    if (!is.na(at)){ axis(1,at=at,labels = i,tck= -0.02)}
    }
labelpos<- paste0(rep(1:12,each=3),"/",c(10,20))
for (i in labelpos){
    at<- b[match(i,labels)]
    if (!is.na(at)){ axis(1,at=at,labels = i,tck= -0.01)}
    }
# Add comma separator to axis labels
axis(side=2, at=axTicks(2), labels=formatC(axTicks(2), format="d", big.mark=','),las=1)
text(x=par("usr")[2],y=c(XY[nrow(XY),1]/2,XY[nrow(XY),1]+max(XY[,2],na.rm=T)/2,XY[nrow(XY),1]+max(XY[,2],na.rm=T)+max(XY[,3],na.rm=T)/2),
    labels=formatC(c(XY[nrow(XY),1],max(XY[,2],na.rm=T),max(XY[,3],na.rm=T)),format="d", big.mark=','),xpd=T,pos=4)
text(x=par("usr")[2],y=max(nCoV[1,],na.rm=T),
    labels= paste0("Confirmed\n",formatC(max(nCoV[1,],na.rm=T), format="d", big.mark=',')),col="darkgreen",xpd=T,pos=4)
title("回復された方、亡くなった方、療養中の方の推移(新型コロナウイルス)",cex.main=1.5)
#dev.off()
致死率(%):Deaths/Confirmed の推移
# nCoVの2行目 / nCoVの1行目
MR<- round(nCoV[2,]/nCoV[1,] *100,3)
#png("Coronavirus01_1.png",width=800,height=600)
par(mar=c(5,6,3,4),family="serif")
plot(MR,type="l",lwd=2.5,las=1,xaxt="n",ylab="Reported deaths / Reported cases",bty="l",xlab="")
box(bty="l",lwd=2)
labels<-sub("/20","",colnames(nCoV))
labels<-gsub("^.*/","",labels)
pos<-gsub("/.*$","",sub("/20","",colnames(nCoV)))
axis(1,at=1:ncol(nCoV),labels =NA)
#月の区切り
#axis(1,at=cumsum(as.vector(table(pos)))+0.5, labels =NA,tck=-0.1,lty=2 ,lwd=1)
axis(1,at=1,labels ="22")
for (i in c("1","10","20")){
    at<- grep("TRUE",is.element(labels,i))
    axis(1,at=at,labels = rep(i,length(at)))
    }
#Month<-c("January","February","March","April","May","June","July","August","September","October","November","December")
Month<-c("Jan.","Feb.","Mar.","Apr.","May","Jun.","Jul.","Aug.","Sep.","Oct.","Nov.","Dec.")
#cut(1:12,breaks = seq(0,12),right=T, labels =Month)
mon<-cut(as.numeric(names(table(pos))),breaks = seq(0,12),right=T, labels =Month)
# 月の中央
#mtext(text=mon,at=cumsum(as.vector(table(pos)))-as.vector(table(pos)/2),side=1,line=2)
# 月のはじめ
mtext(text=mon,at=1+cumsum(as.vector(table(pos)))-as.vector(table(pos)),side=1,line=2)
text(x=par("usr")[1],y=par("usr")[4],labels="(%)",pos=2,xpd=T,font=2)
text(x=par("usr")[2],y=MR[length(MR)],labels=paste(MR[length(MR)],"%"),xpd=T)
title("Covid-19 : Death rates(致死率)")
#dev.off()
死亡者数 900人以上の国の致死率(%):Deaths/Confirmed の推移
# Country/Regionごとに集計
#Confirmed
Ctl<- aggregate(Confirmed[,5:ncol(Confirmed)], sum, by=list(Confirmed$"Country/Region"))
rownames(Ctl)<-Ctl[,1]
Ctl<- Ctl[,-1]
#Deaths
Dtl<- aggregate(Deaths[,5:ncol(Deaths)], sum, by=list(Deaths$"Country/Region"))
rownames(Dtl)<-Dtl[,1]
Dtl<- Dtl[,-1]
#
# 死亡者数 900人以上の国
#
min<- 900
max<- Inf
dat<-Dtl[apply(Dtl,1,max,na.rm=T)>=min & apply(Dtl,1,max,na.rm=T)< max,]
# "Diamond Princess"を除く
dat<-dat[grep("Diamond Princess",rownames(dat),invert = T),]
#rownames(dat)
dat<- dat[order(dat[,ncol(dat)],decreasing=T),]
knitr::kable(dat[,ncol(dat),drop=F])
#
# 致死率(%)計算
#DpC<- matrix(NA,nrow=nrow(dat),ncol=ncol(dat))
DpC<- NULL
for (i in rownames(dat)){
    temp<- round(dat[rownames(dat)== i,] / Ctl[rownames(Ctl)== i,]*100,2)
    DpC<- rbind(DpC,temp)
}
#
DpC<- DpC[order(DpC[,ncol(DpC)],decreasing=T),]
n<-nrow(DpC)
col<- rainbow(n)
pch<-rep(c(0,1,2,4,5,6,15,16,17,18),3)
#png("Coronavirus01_1_1.png",width=800,height=600)
par(mar=c(3,5,4,10),family="serif")
#40日めから
matplot(t(DpC)[40:ncol(DpC),],type="o",lwd=2,pch=pch,las=1,col=col,ylab="Reported Deaths/Reported Confirmed(%)",xaxt="n",ylim=c(0,20))
axis(1,at=1:nrow(t(DpC)[40:ncol(DpC),]),labels=sub("/20","",rownames(t(DpC)[40:ncol(DpC),])))
legend(x=par("usr")[2],y=par("usr")[4],legend=rownames(DpC),pch=pch,lwd=2,col=col,bty="n",title="Country/Region",xpd=T)
title(bquote("Reported Deaths / Reported Confirmed (%) ( Reported"~Deaths>=.(min)~")"))
#dev.off()
報告された感染者数が一定数超えた時点を起点とした折れ線グラフ
片対数グラフ(Semi-log plot)ここでは、報告された感染者数 10000人以上
- min,max : 報告された感染者数 min 人以上、max 未満
- Sp : Starting pointとする感染者数
- length : Starting pointとする感染者数に合わせるための調整
- xlim : x軸の範囲
min<- 10000
max<- +Inf
G600<- Ctl[apply(Ctl,1,max,na.rm=T)>= min & apply(Ctl,1,max,na.rm=T)< max,]
# Diamond Princessを除く
G600<-G600[grep("Diamond Princess",rownames(G600),invert =T),]
G600<-G600[order(apply(G600,1,max,na.rm=T),decreasing=T),]
col<- rainbow(nrow(G600))
#
#Starting point
Sp<- 600 # Starting pointとする感染者数
length<- 10 # Starting pointとする感染者数に合わせるための調整
xlim=c(-10,45) # 範囲
col<- rainbow(nrow(G600))
pch<- rep(c(0,1,2,4,5,6,15,16,17,18),6)
#png("CoronavirusG600.png",width=800,height=600)
par(mar=c(5,4,4,2),family="serif")
#
plot(1,1,type="n",xlab=paste0("Days since reported cases reach ",Sp),
    ylab="Number of reported cases (log10)",yaxt="n",log="y",
    ylim=c(0.9,2*10^5),xlim=xlim,yaxs="i")
abline(v=seq(-20,40,10),col=c("gray","gray","black","gray","gray","gray","gray"),lty=3)
for(i in 0:6){
  abline(h=seq(1,9)*10^i,col="gray",lty=3)
}
box(lwd=2.5)
#
for (i in 1:length(col)){
p0<- as.numeric(G600[i,])
p<-NULL
for (j in 1:(length(p0)-1)){
    p<- c(p,seq(p0[j],p0[j+1],length=length))
}
p1<- length(p[p<Sp])
p2<- length(p[p>=Sp])
lines(seq(-p1/length,(p2/length - 1/length),1/length),p,lwd=0.8,col=col[i])
points(seq(-p1,p2,length)/length,p0,cex=0.8,col=col[i],pch=pch[i])
if (i== grep("Japan",rownames(G600))){
    text(x=p2[length(p2)]/length,y=p0[length(p0)],labels="Japan",cex=1.2,col="black",pos=4)
    }
if (i== grep("Korea, South",rownames(G600))){
    text(x=p2[length(p2)]/length,y=p0[length(p0)],labels="South Korea",cex=1.2,col="black",pos=4)
    }
#if (i== grep("Singapore",rownames(G600))){
#    text(x=p2[length(p2)]/length,y=p0[length(p0)],labels="Singapore",cex=1.2,col="black",pos=4)
#    }
}
for(i in 0:6){
  axis(side=2, at=10^i, labels=bquote(10^.(i)) ,las=1)
  axis(side=2, at=seq(2,9)*10^i, tck=-0.01,labels=F)
}
legend(x="bottomright",inset=c(0.03,0.01),ncol=4,legend=rownames(G600),pch=pch,lwd=1,col=col,xpd=T,
    bty="n",x.intersp= 1,y.intersp =1,cex=1)
#legend(x=par("usr")[2],y=10^par("usr")[4],legend=rownames(G600),pch=pch,lwd=1,col=col,xpd=T,bty="n",cex=1,ncol=2)
# dev.off()
最後の日付のデータのみ取り出す(drop=F : data.frameで)
Confirmed,Deathsのデータをmergeし、致死率計算
# key : row.namesでmerge
DRbyC<- merge(Ctl[,ncol(Ctl),drop=F],Dtl[,ncol(Dtl),drop=F],by="row.names")
#DRbyC$Row.namesをrownames(DRbyC)に
rownames(DRbyC)<- DRbyC$Row.names
DRbyC<- DRbyC[,-1]
colnames(DRbyC)<- c("Confirmed","Deaths")
# death rate = Deaths/Confirmed *100
DRbyC$Death.rate<- round(DRbyC$Deaths/DRbyC$Confirmed *100,4)
報告された感染者数 10000人以上の国だけをとりだす。
min<- 10000
DR<- DRbyC[DRbyC$Confirmed >= min ,]
# Diamond Princessを除く
DR<- DR[grep("Diamond Princess",rownames(DR),invert =T),]
報告された感染者数が10000人以上の国ごとの感染者数の棒グラフ
# Confirmedの昇順に並べ替え
DR<- DR[order(DR$Confirmed,decreasing=F),]
#png("Coronavirus01_2.png",width=800,height=800)
par(mar=c(5,10,3,7),family="serif")
b<- barplot(t(DR)[1,],las=1,horiz=T,xaxt="n",col="pink")
axis(side=1, at=axTicks(1), labels=formatC(axTicks(1), format="d", big.mark=','))
text(x=t(DR)[1,],y=b,labels=formatC(t(DR)[1,], format="d", big.mark=','),pos=4,xpd=T,font=1)
title(bquote("Reported confirmed COVID-19 cases (Country/Region : "~Positive>=.(min)~")"))
#dev.off()
報告された感染者数が10000人以上の国ごとの致死率の棒グラフ
# Death.rateの昇順に並べ替え
DR<- DR[order(DR$Death.rate,decreasing=F),]
#
# Japan の色だけ変える
TF<- is.element(colnames(t(DR)),c("Japan"))
col<- gsub("TRUE","red",gsub("FALSE","lightblue",TF))
col2<- gsub("TRUE","red",gsub("FALSE","black",TF))
# 韓国の色も変えたいなら
col[grep("Korea, South",rownames(DR))]<- "orange"
col2[grep("Korea, South",rownames(DR))]<- "orange"
# png("Coronavirus01_3.png",width=800,height=800)
par(mar=c(6,10,4,3),family="serif")
b<- barplot(t(DR)[3,],las=1,col=col,horiz=T,names=NA)
axis(2, at = b,labels=NA,tck= -0.008)
text(x=par("usr")[1],y=b, labels = colnames(t(DR)), col = col2,pos=2,xpd=T,font=3)
mtext("Reported deaths / Reported cases (%)",side=1,line=3)
title(bquote("Covid-19 : Death rates by country (%) (Country/Region : "~Positive>=.(min)~")"))
#dev.off()
githubで見つけたDataComputingパッケージの CountryDataデータ
CountryData: Many variables on countries from the CIA factbook, 2014.
#install.packages("remotes")
#remotes::install_github("DataComputing/DataComputing")
library(DataComputing)
data("CountryData")
#country: Name of the country.
#area: area (sq km), 2147
#pop: number of people
#
# 報告された感染者数 10000人以上の国
min<- 10000
G10000<- Ctl[apply(Ctl,1,max,na.rm=T)>= min ,]
# Diamond Princessを除く
G10000<-G10000[grep("Diamond Princess",rownames(G10000),invert =T),]
G10000<-G10000[order(apply(G10000,1,max,na.rm=T),decreasing=T),]
cdata<- CountryData[is.element(CountryData$country,rownames(G10000)),1:3]
#nrow(G10000) ; nrow(cdata) が等しくない
rownames(G10000)[!is.element(rownames(G10000),cdata$country)]
#[1] "US"      "Czechia"
#CountryData$country
# アメリカのnameがCountryDataは"United States" ジョンズ・ホプキンス大学のデータは"US"
# チェコ共和国のnameがCountryDataは"Czech Republic"ジョンズ・ホプキンス大学のデータは"Czechia"
( cdata<- CountryData[is.element(CountryData$country,c("Czech Republic","United States",rownames(G10000))),1:3] )
# 確認(同数か否か)
nrow(G10000) ;nrow(cdata)
#
# cdataのUnited StatesをUSに変更(ジョンズ・ホプキンス大学のデータに合わせる)
cdata$country<- sub("United States","US",cdata$country)
cdata$country<- sub("Czech Republic","Czechia",cdata$country)
# 人口密度(population density)
cdata$population_density<- round(cdata[,3]/cdata[,2],2)
# 最新の報告された感染者のみ取り出し、merge
dat<- G10000[,ncol(G10000),drop=F]
dat$country<- rownames(dat)
cdata<- merge(cdata,dat,by="country")
colnames(cdata)[5]<- "Confirmed"
# 報告された感染者 / 人口 *100
cdata$Confirmed_per_Pop<- round(cdata$Confirmed/cdata$pop*100,6)
# 報告された感染者 / 人口 *100 の昇順に並べ替え
cdata<- cdata[order(cdata$Confirmed_per_Pop,decreasing=F),]
knitr::kable(cdata[,c(1,3:6)],row.names=F)
barplot
#png("Coronavirus01_4.png",width=800,height=800)
par(mar=c(5,8,4,2),family="serif")
barplot(cdata$Confirmed_per_Pop,names=cdata$country,las=1,horiz=T,col="lightblue")
title(bquote("Reported confirmed / number of people *100 (Reported "~confirmed>=.(min)~")"))
#dev.off()
Plot in Plot
load("Wtest.Rdata")
load("Jtest.Rdata")
shp <- system.file("shapes/jpn.shp", package = "NipponMap")[1]
m <- sf::read_sf(shp)
for (i in 1:47){
    Jtest[i,1]<- sub(Jtest[i,1],m$name[i],Jtest[i,1])
}
# 人口100万人あたりの検査数
Jtest$人口100万人あたりの検査数<- round((1000000*Jtest$検査人数)/m$population,0)
# 陽性者数 > 20
df2<- Jtest[Jtest$陽性者数>20,c(1,3,5)]
df3<- Wtest[Wtest[,1]=="Japan",c(1,2,6)]
colnames(df2)<- colnames(df3)
df2<- rbind(df3,df2)
#
lim<-max(Wtest[,"Tests /millionpeople"],na.rm=T)*1.1
min<- 10000
df<- Wtest[!is.na(Wtest[,"Positive"]),]
df<- df[df[,"Positive"]>=min,]
jnum<- df[df[,1]=="Japan","Tests /millionpeople"]
#
# Tests /millionで並べ替え
df<- df[order(df[,"Tests /millionpeople"]),]
color<- is.element(df[,1],"Japan")
col<- gsub("FALSE","lightblue",gsub("TRUE","red",color))
col2<- gsub("FALSE","black",gsub("TRUE","red",color))
#
# デフォルト:par(mar=c(5,4,4,2)+0.1)
#par(fig=c(0,1,0,1),mar=c(3,5,3,2),family="serif")
# png("overlay01.png",width=800,height=800)
par(mfrow=c(1,1),fig=c(0,1,0,1),mar=c(3,12,3,2),family="serif")
b<- barplot(df[,"Tests /millionpeople"],horiz=T,col=col,xaxt="n",xlim=c(0,lim))
axis(side=1, at=axTicks(1), labels=formatC(axTicks(1), format="d", big.mark=','))
axis(2,at=b,labels=NA,col=col2,tck=-0.01)
text(x=par("usr")[1],y=b, labels = df[,1], col = col2,pos=2,xpd=T)
# bquote
title(bquote("Tests /million for COVID-19("~Positive>=.(min)~")"))
abline(v=jnum,lty=2,col="red")
arrows(x0=df[df[,1]=="Japan","Tests /millionpeople"]*4, y0=grep("TRUE",color)+0.5, x1=25000, y1=25,col="red", lty=1, lwd=5)
#par(mar=c(10,16,10,2.5),family="serif",new=T)
#右上
#par(fig=c(0.5,1,0.5,1),family="serif",new=T)
#右下
par(fig=c(0.5,1,0,0.5)+c(-0.1,-0.1,0.1,0.2),mar=c(3,6,4,2),family="serif",new=T)
b<- barplot(rev(df2[,3]),horiz=T,col=c(rep("pink",nrow(df2)-1),"red"),las=1)
axis(2,at=b,labels=NA,col=col2,tck=-0.01)
text(x=par("usr")[1],y=b, labels =rev(df2[,1]), col = c(rep("black",nrow(df2)-1),"red"),pos=2,xpd=T)
title("Tests /million:Prefectures of Japan\n(More than 20 COVID-19 cases reported)")
abline(v=jnum,lty=2,col="red")
# dev.off()